
You’ve built what you believe to be a solid investment portfolio, but only time will tell how the portfolio performs and what changes might need to be made in the future. How can you measure how well your investments are doing?
One of the most common ways to gauge your investment portfolio is known as the money-weighted rate of return, abbreviated MWR or MWRR.
Used by fund managers and individual investors alike, MWR is one of the best ways to see how your portfolio is performing while weeding out the noise of regular contributions or regular withdrawals.
What Is the Money-Weighted Rate of Return (MWR)?
The money-weighted rate of return is a metric used to determine a portfolio’s performance while taking the timing of cash flows into account, meaning your returns won’t be skewed positively by contributions or negatively by withdrawals.
Motley Fool Stock Advisor recommendations have an average return of 618%. For $79 (or just $1.52 per week), join more than 1 million members and don’t miss their upcoming stock picks. 30 day money-back guarantee. Sign Up Now
The MWR also takes the timing of cash flows into account, which is crucially important because one day in the stock market can mean the difference between gains and losses.
For example, say you have a portfolio worth $1,450 today. You started the portfolio about a year ago with a $1,000 initial investment. Six months ago, you made a contribution of $500 to your portfolio. Comparing the start point of the portfolio to today, it looks like you gained $450, but by accounting for the contribution you made six months ago, the portfolio has actually taken a $50 loss.
By accounting for cash flows, you end up with a more accurate picture of how your investment portfolio performed over time.
How to Calculate the Money-Weighted Return
Calculating your money-weighted return manually involves an admittedly intimidating-looking formula. But don’t worry — any spreadsheet software will help make these calculations for you. But, to understand why they work, let’s look at the mathematical formula for calculating money-weighted rate of return:
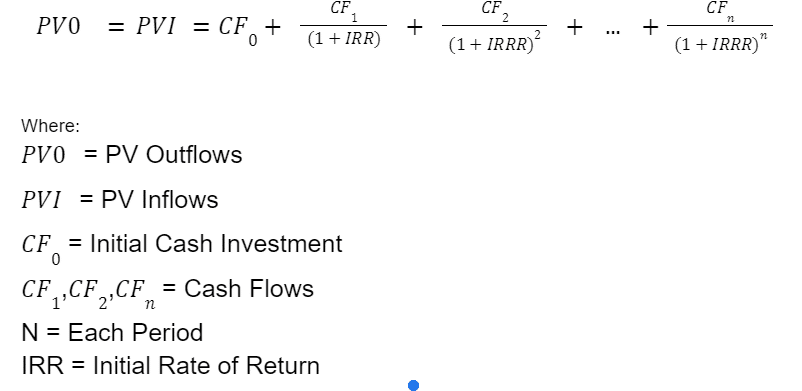
If it weren’t for tools like Microsoft Excel and Google Sheets, finding the money weighted return would be very difficult for the average person. That’s because the calculation includes the IRR, or initial rate of return, also referred to as the internal rate of return, which requires the use of trial and error rather than analytical computation.
The goal of the calculation is to find the rate of return that results in the initial investment being equal to the present value of all cash flows.
Understanding Net Present Value
Before we dive too deeply into the formula, it’s important that you understand the concept of net present value, or NPV. NPV refers to the current value of future money.
For example, if your friend said he would give you $200 next year, what would the value of that promise be worth today? To find this, you need to know the rate of return you would expect from your investments during the year.
Say you’d expect to earn 5% returns in the year between now and when your friend gives you $200. You’d use the following formula to calculate the NPV of that $200 a year from now:
NPV = 200 ÷ (1 + 0.05)
In this case, the net present value is about $190.48.
When calculating your MWRR, your ultimate goal is to find the return rate that will make all net present values of all cash flows equal to zero. This means the goal is to make present value outflows equal to present value inflows, as outlined in the formula above.
Calculating MWR in a Spreadsheet
The easiest way to calculate your MWRR is with a Microsoft Excel spreadsheet or Google Sheet.
To create your spreadsheet, start by creating a column for dates and one for values. In the first row, enter the beginning date of your measurement period and the balance you began with.
Then create new rows for each inflow and outflow of cash. Each row should include the date of the transaction and the amount of cash flowing into or out of the portfolio on that date, with withdrawals represented by negative numbers.
Finally, in the last row, enter the ending date of the measurement period and the ending value of the portfolio as a negative. For example, if the ending value is $12,180, you would enter it as -12,180.
Next, you’ll want to work in the row just below the data you’ve put into your spreadsheet. Use the XIRR formula in Excel or Google Sheets to calculate the internal rate of return on investment for all the information you’ve entered.
From there, the spreadsheet will do its magic, providing you with an accurate MWR.
What Money-Weighted Return Measures
The money-weighted return is one of many measures of portfolio performance. Whereas other measures focus heavily on the growth rates of assets within the portfolio, this metric also puts emphasis on the timing and amount of cash inflows and cash outflows.
That’s important because it shows the rewards or costs of your decision to make contributions or deductions at specific time periods. This is valuable because it shows how well your market timing is working out for you.
As an example, say two investors, Jen and John, invested in the same stock over the same period of time, but made new contributions at different times throughout the period. Imagine Jen had a knack for making contributions right before the stock rose higher and John had the misfortune of contributing his money right before the stock fell.
The two investors would end up with significantly different returns over the same period of time, even though they were investing in the same exact asset. Since Jen had better timing, her MWRR would be far higher than John’s.
MWR vs. Other Rates of Return
There are several investment performance metrics that are used to determine how well you’re doing in the market. Here’s how the MWR compares to the two most popular alternatives:
Time-Weighted Return (TWR or TWRR) vs. MWR
With the time-weighted rate of return (TWR), each time a contribution or deduction is made, you create a new sub-period, and the returns for that time period are calculated. You then find the geometric mean of the returns for these smaller time periods to generate the TWR.
The time-weighted return method ignores contributions and deductions, showing investors the growth, or lack thereof, of the assets within their portfolios in more detail.
If you invest in a mutual fund centered around the S&P 500, your returns using the TWR will be similar to the benchmark’s returns regardless of when cash flows took place into or out of your account and the amounts of the contributions or deductions.
On the other hand, when using the MWR, the timing and amount of your contributions and deductions will play a significant role in your rate of return, leading to your returns being different from the underlying benchmark.
Dietz Method vs. MWR
The Dietz method was created before computers were widely available. It was a method for calculating a cash-weighted rate of return without having to do complex computations and take part in trial and error. That said, the formula for employing the Dietz method is still fairly complicated.
While a modified version of the Dietz method is still a commonly used tool, especially among portfolio managers reporting results to clients, it can be less accurate than the MWR.
Considering today’s access to technology, the MWR is generally a better option for investors.
MWR Pros and Cons
As with any other financial metric or tool used by investors, the MWR comes with its own list of pros and cons. Here are the most important to consider.
Pros of MWR
The MWR is a popular metric among investors, both institutional and individual. There are a couple of key benefits to using it:
Understand Your Market Timing
Nowhere is the expression “time is money” more true than in the stock market.
With the MWR calculation, you’ll be able to determine how well you’re performing in terms of market timing. If you find that your timing is a bit off, you can tweak your strategy to generate better returns.
Determining the Success of Your Hired Experts
If you have a financial advisor or investment advisor telling you when to make contributions or making your investments for you, it’s important to consider your money-weighted returns to determine how effectively they’re using your money in the market.
A low MWR may suggest it’s time to entrust your portfolio to another professional.
Cons of MWR
While there are some positives to using the MWR to calculate the returns of your portfolio or a fund you’re interested in investing in, there are also limitations to consider:
Emphasizes Timing, Not Asset Performance
While an asset’s performance will play a big role in the MWR calculation, the larger emphasis is placed on the timing of contributions and deductions. As a result, a portfolio that is likely to perform poorly over time may show positive returns, and a strong long-term portfolio can show negative returns.
For example, if you were to make a large contribution in a stock just before an upswing, the data would have an upward skew when determining your MWR, as more money weighting during the upswing will more than offset declines when less money was in the portfolio. This can make a weak investment look stronger than it is because you happened to time your contribution well.
A large contribution just before a correction in an asset that’s a strong long-run play otherwise may result in a negative MWR. This can make a strong long-term investment look like an underperformer due to a short-term drop you happened to catch.
Skews Results of Fund Managers
Although the money-weighted return rate is a great indicator of how professionals are working on your behalf, it can also work for or against fund managers. That’s because these managers have no control over the size or timing of cash flow into and out of their funds.
For example, if a large investor makes a big withdrawal just before a strong upward run, the money-weighted performance of the fund will seem lighter than before, even if its underlying assets are doing well. This is because the fund now has less money invested during the rising market.
Final Word
The money-weighted rate of return definitely has its place on Wall Street, but it’s important to remember that it’s not the end-all-be-all.
To get an accurate depiction of a portfolio’s performance, it’s best to determine both the MWR and TWR. In doing so, you’ll have valuable insight into both how your market timing is working out for you and how the underlying assets in your portfolio are performing.