The real estate market is still as hot as its ever been. Despite rising interest rates over the past few months, the market continues to set new records.
Many anecdotes point to it being a simple farce. For example, homes have sold for a million dollars over asking price in San Jose, Washington D.C., and San Francisco.
In Jackson County, Missouri (which holds most of Kansas City), only 0.8 months of inventory was left in March. In other words, for every five homes that sold in March, four remained on the market going into April. For comparison’s sake, a “balanced” market that favors neither buyers nor sellers has six months of inventory.
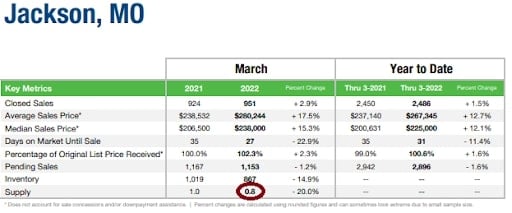
Overall, prices are up 14% year-over-year and have almost doubled since the trough of the Great Recession. But a few other national stats from Forbes paint an even better picture:
- “Active listings (the number of homes listed for sale at any point during the period) fell 22% from 2020 and 41% from 2019.
- “45% of homes that went under contract had an accepted offer within the first two weeks on the market.
- “32% of homes that went under contract had an accepted offer within one week of hitting the market.
- “43% of homes sold above list price.”
Indeed, the average sales price was 100.5 percent of asking. If you look at home prices from 2000 to the present, even the Great Recession looks like little more than a minor setback:
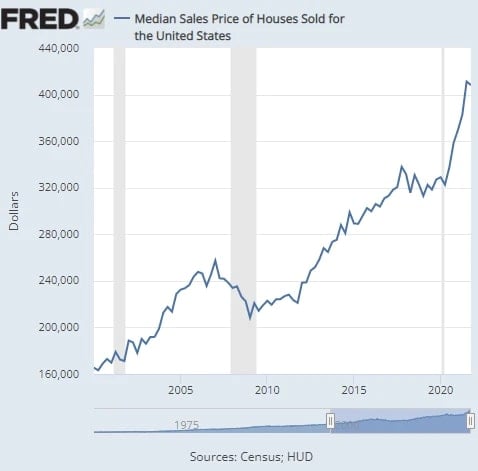
And while the pace of increases has slowed with rising interest rates, it’s still on an upward trajectory.
But why is this happening?
The correct answers relate to COVID-19 and the Great Recession itself. But let’s start with what’s not causing the housing boom despite the endless proclamations from various pundits.
Non-Cause #1: Wall Street
Wall Street always makes for a good villain, and they certainly have had their share of scandals. For one, CEO of Gravity Payments, Dan Price, stated that Wall Street firms owned over 15% of all single-family residences.
Fortunately, he was off by a factor of about 30. If Wall Street is trying to make “a nation of renters,” they’re doing it at a snail’s pace.
In 2018, there were about 83.3 million single-family homes in the United States. As Gary Beasley notes in Forbes,
“Researchers at my company, Roofstock, estimate that large-scale landlords today own approximately 450,000 of the roughly 20 million single-family rentals in the U.S. While this represents considerable growth over the past decade, it represents less than 2.5% of all single-family rentals and less than 0.5% of all single-family homes (including owner-occupied).”
While the added competition Wall Street brings will technically affect prices, the margin is negligible. Furthermore, the share of single-family properties being bought by investors of all kinds has actually been declining since 2013.
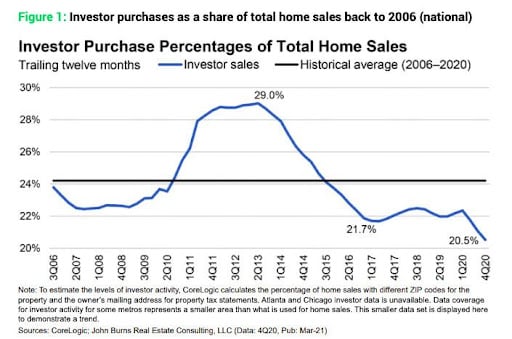
Wall Street’s effect on housing prices is tiny. So if it’s not Wall Street, what’s another popular villain to blame?
Non-Cause #2: The War in Ukraine
Russia’s invasion of Ukraine has certainly exacerbated supply chain issues globally. Still, it is not the cause of inflation in general and certainly not the cause of price increases in housing. Indeed, inflation was already 7.5 percent in January and 7.9 percent in February. The invasion of Ukraine started on February 24.
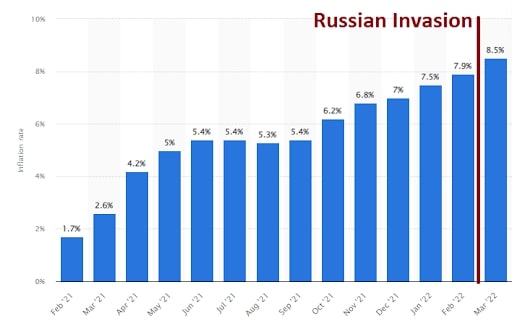
This excuse seems bizarre to me. While the timing is off with inflation, it’s wildly off with housing prices.
Like Wall Street, it may be fun to blame Putin for everything, but this one isn’t on him.
So let us turn to what is really driving home prices through the roof.
Cause 1: More Money, More Inflation
“Inflation is always and everywhere a monetary phenomenon,” the famous economist Milton Friedman once said. I think this is a little simplistic, but it’s certainly true that all things being equal, more money will equal more inflation.
And there is undoubtedly a lot more money in the economy these days. According to Tech Startups, about 80% of all dollars in circulation were printed since the beginning of 2020! While these numbers have been challenged to varying degrees, there is no question that a lot of money was pumped into the economy as Covid threw the entire world into a tailspin.
For example, here is the Fed’s chart for the money supply:
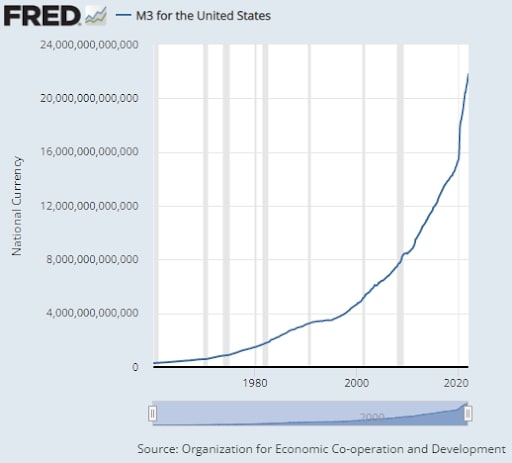
Milton Friedman, as mentioned earlier, also introduced us to the Quantitative Theory of Money. The equation looks like this:
M (money supply) x V (velocity) = P (price level) x T (Volume of Transactions)
In other words, the amount of money multiplied by how fast it’s spent equals the prices multiplied by the amount of stuff being bought.
During the height of Covid, the money supply dramatically increased at the same time the economy took a nosedive. In many ways, these two things counteracted each other as the economy’s slowdown in 2020 reduced the “velocity” of money. To put it simply, the number of times each dollar was spent decreased. This is what kept inflation in check during 2020 and for most of 2021.
So, for example, if I have one dollar and buy a widget from you, and then you turn around and buy a piece of candy from John, that dollar has been used in two transactions. The velocity of that dollar stands at two, and there might as well have been $2 in the economy. On the other hand, if I had two dollars and then bought a widget from you and a piece of candy from John and both of you held that dollar, the velocity of each dollar is one.
In the second scenario, the money supply is twice as large, but the inflationary effect is the same as in the first scenario since each dollar is spent only once.
Whenever there is a recession, velocity is reduced. But now that the economy has picked up again as COVID has waned, velocity is accelerating, but with many more dollars in circulation. Thus, we have a higher money supply (M) and higher velocity (V).
Thus, inflation.
In the end, what we call “appreciation” in real estate is really just housing inflation. But that doesn’t sound as nice, so we made up a different word for it.
Of course, housing inflation is particularly spurred on by interest rates, which despite recent increases, are still at historic lows.
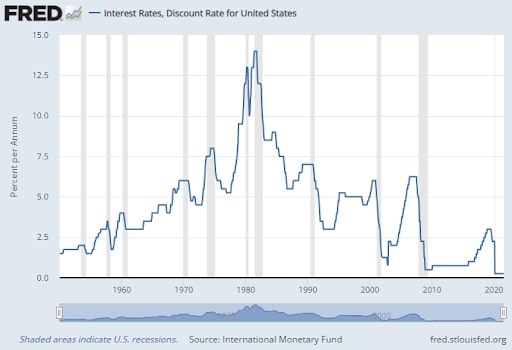
The discount rate is the rate that the Federal Reserve lends to other banks. Historically speaking, it has mostly hovered between 2%-6% but has climbed as high as 13% when Paul Volcker decided to “break the back of inflation” in the early 1980s.
The discount rate has been below 3% since the Great Recession of 2008 and has remained around one. It dropped to zero after COVID, and the Fed only raised it again in March 2022.
Even the Fed’s announced plan of raising the discount rate to 1.9% by the end of 2022 and to 2.8% by the end of 2023 would keep the discount rate below the historical average.
Interest rates are also low in real terms (versus nominal). Given that inflation is at 8.5% around late April 2022 and the average 30-year mortgage is just over 5%, that still means the cost of borrowing is less than inflation, which really shouldn’t be a thing. And, of course, interest rates a year ago were even lower, with some people getting mortgages under 3%, somehow.
Low-interest rates obviously encourage home purchases. In addition to that, there are still a ton of government incentives to purchase a home. For example, FHA loans allow buyers to get in for as little as 3.5% down.
According to Economics 101: More money chasing fewer goods (fewer houses, in this case) means prices go up.
Cause #2: A Historic Housing Shortage
While some of the housing price explosion has its roots in 2020, much of it goes back to 2008. As is typical, we over-corrected for the real estate-driven financial crisis of 2008.
I remember driving through empty subdivisions that littered the country in the years following the Great Recession. It was surreal.
Those days, however, are long gone. The shell shock of that crisis caused the government, banks, and developers to all, implicitly at least, stop building.
But the population of the United States didn’t stop growing.
From 2000 to 2007, there were at least a million housing starts each year. From 2005 to 2007, there were over two million. Then the crisis hit, and housing starts fell through the floor. They didn’t break one million again until 2020, and then Covid happened, and the lockdowns shut down and delayed every new construction project.
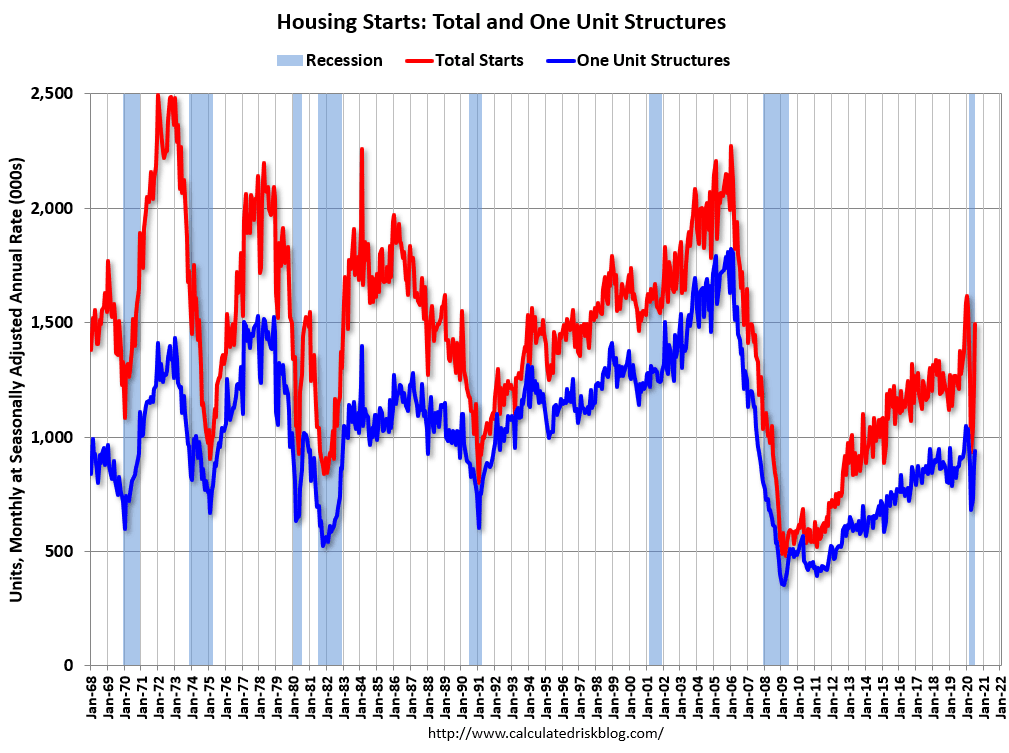
Virtually everyone predicted the real estate market would collapse when COVID hit. Weirdly, no one seemed to realize it would simply exacerbate the housing shortage that was already acute.
Freddie Mac released a study purporting to show a 3.8-million-unit housing shortage in the United States in 2020. This is up from 2.5 million just two years earlier.
Supply and demand are undefeated. When demand outpaces supply by that much, you can expect a few upper-end homes in coastal cities to go for a million over asking. Furthermore, houses and apartments take time to build, especially since strict permitting and zoning regulations often impede development. This is not a shortfall that can be quickly resolved.
Supplemental Causes
While increases in the money supply and a nationwide housing shortage are the main drivers of housing prices, a few other supplemental causes could be thrown in with Wall Street and the war in Ukraine as minor accelerants.
For one, there have been a lot of supply chain issues of late that have caused all sorts of costs to increase. The most noteworthy in the real estate world has been lumber, but it’s also a systemic problem.
Supply chain issues have exacerbated inflation, caused development and rehab projects to be delayed, and forced housing suppliers to pass prices onto consumers. But to believe that everything will return to normal when these issues are resolved is, unfortunately, wishful thinking.
In addition, Airbnb has been accused of choking supply as well. Presumably, as more homeowners decided to use their house as a short-term rental, this should have hurt the hotel industry and caused a boon in home construction to fill the gap. But, there was no boon to development, so the housing shortage was exacerbated.
One study, for example, found “that a 1% increase in Airbnb listings leads to a 0.018% increase in rents and a 0.026% increase in house prices.” While that does count as an effect, like Wall Street, it’s negligible. There are some 660,000 Airbnb listings in the United States. Some of these are for a spare bedroom or only used as a short-term rental part of the time. But even if you assumed all 660,000 were single-family residences, it would be less than 1% of the total housing stock.
Conclusion
There are many reasons housing prices are skyrocketing. By far, the two most significant have been low-interest rates and the corresponding increase in the money supply along with a historic nationwide housing shortage.
Furthermore, while interest rates are increasing, they’re still well behind inflation, and the housing shortage isn’t going away any time soon. Overall, we can expect prices to continue to rise, although probably at a slower rate, as interest rates climb and we reach affordability limits.
We can expect housing prices to remain high for the foreseeable future.