It is that time of the year for the prognosticators to make their forecasts of what the markets will be like next year and perhaps for the adventurous few to project out the next ten to thirty years. “Do I have enough saved to retire if the stock and bond markets do not keep up with inflation for twenty years?” It is not a rhetorical question to ask ourselves.
I don’t want to be the Grinch who steals Christmas, but I hope for the best and prepare for lower long-term returns. Enjoy your favorite holiday meals, especially the desserts.
After reviewing the ten-year investing landscape, I believe the risk of another secular bear market starting during this decade is high. In this article, I review the reasons for this belief and what Fidelity, Vanguard, and the Financial Elders see on the horizon. The final section reflects some of the small adjustments that I am making to my plans.
This article is divided into the following sections:
OVERVIEW OF SECULAR MARKETS
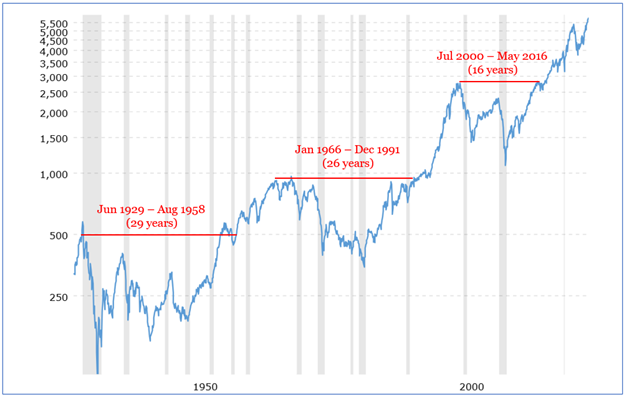
Figure #1 shows the S&P 500 for the past hundred years adjusted for inflation. A dollar in 2007 would have 31% more purchasing power than a dollar in 2024 due to inflation. The chart does not include the benefits of dividends. Dividends have largely been replaced by stock buybacks since the mid-2000s and were further lowered by easy monetary policy. The DQYDJ calculator can be used to estimate the return of the S&P 500 with dividends and adjusted for inflation for the twenty-six-year period from January 1966 to December 1991 to be 3.8% and for the sixteen years from July 2000 to May 2016 to be just under 2.0%.
Figure #1: S&P 500 Adjusted for Inflation
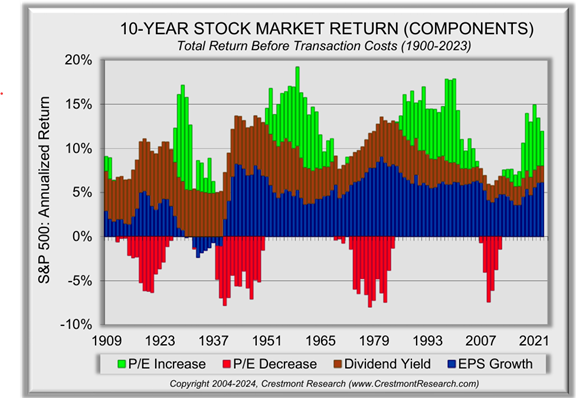
Ed Easterling is the founder of Crestmont Research and author of Unexpected Returns: Understanding Secular Stock Market Cycles and Probable Outcomes: Secular Stock Market Insights. These books and his website formed the foundation of my retirement planning. Mr. Easterling shows the Components of Stock Market 1o-Year Rolling Returns in Figure #2. Changes in valuation are the key driver of stock market returns during secular markets. Note that valuations are currently high which suggests below-average returns in the coming decade(s). In addition, long periods of high inflation are usually associated with falling valuations. Mr. Easterling describes secular bull markets as a time for sailing, and secular bear markets as a time for “rowing” meaning active investment management.
Figure #2: Components of Rolling 10-Year Stock Market Returns
CAPITAL MARKETS IN THE COMING DECADE
The stock market rose following Donald Trump’s election victory as stock investors relished tax cuts while bond yields rose as bond investors expected rates to remain higher for longer to pay for higher deficits along with the expectation of higher inflation.
One of the key questions is “Will huge deficits weigh on GOP plan to slash taxes?” asked by Yuval Rosenberg and Michael Rainey at right-leaning The Fiscal Times. They state, “The same dynamic played out in 2017, when lawmakers settled on a 10-year cost of $1.5 trillion for their tax package, even as some pushed for a larger number. But whatever the number ends up being, it looks like a larger deficit and increased debt are likely this time around.” Republicans may add Trump’s proposed tariffs “even if those revenues have little chance of materializing”. Moody’s Ratings wrote, “Given the fiscal policies Trump promised while campaigning, and the high likelihood of their passage because of the changing composition of Congress, the risks to US fiscal strength have increased.”
I wrote a detailed technical report, Slow Growth and “Making America Great Again”, on Financial Sense in February 2017 that analyzed taxes and tax avoidance, trade, and economic growth with respect to the potential policies of newly elected President Trump. I made the point that economic growth had slowed due to demographics, declining productivity, low savings, low investment, erosion of the middle class, devastating recessions, automation leading to slow job growth, and high debt levels. Economic growth averaged 2.7% during the first three years of Trump’s presidency before COVID – much less than the 4% from the campaign rhetoric.
Right-leaning Cato Institute wrote The Tax Cut and Jobs Act of 2017 stating that “the effects of the [Tax Cut and Jobs Act] on economic growth and wages were smaller than advertised.” They add that corporate income tax cuts generated substantial benefits but that the claims about these benefits are “significant exaggerations”. The right-leaning Committee for a Responsible Federal Budget wrote in US Budget Watch 2024 that the 2017 tax cuts will increase the national debt by $1.9 trillion over ten years.
The Peter G. Peterson Foundation (Least Biased Media Bias/Fact Check Rating) writes in The Next Fiscal Cliff: Big Tax Decisions to Make in 2025, “Extending all provisions from the TCJA that are set to expire at the end of 2025 would increase deficits by $2.7 trillion from 2024 to 2033, according to CBO and JCT.” The Committee for a Responsible Federal Budget also estimates that President Trump’s preliminary plan will increase the national debt by $7.75 trillion through 2035.
I wrote in the 2017 Financial Sense article, “In 2014, 10% of importers were multinational companies which accounted for over 76% imports. There were over 400,000 companies importing or exporting with 20% of the companies both importing and exporting.” Approximately 35% to 50% of total trade is in the form of multinational companies importing and exporting between divisions. Tariffs will have winners and losers with consumers paying higher prices.
Federal spending has risen from 16% of GDP following WWII to 22% in 1982 and is currently at 23%. I expect there to be a shift from spending on social programs to the military. Elon Musk wants to cut $2 trillion in US spending. Can he do it? by Tom Dempsey at NewsNation describes that the $2 trillion in Federal spending cuts would come from the $6.75 trillion (or 30%) that is currently being spent. Social Security, Medicare, Defense, and Veterans benefits amount to $3.5 trillion. It is unlikely that major cuts can be made to the Federal budget without cutting social benefits.
Consumer spending is the largest component of the economy, and Living Paycheck To Paycheck and the Role of Financial Counselors in the MFO November newsletter shows that the majority of Americans don’t have the income or savings to drive economic growth. The stock market is not the economy! The wealthiest 10%, those with a net worth of $2 million or more, own 93% of the stock market as described by Matt Phillips in Axios. Cutting corporate taxes benefits the wealthy with some hoping the benefits trickle down to the masses.
Stocks: What’s next? by Jurrien Timmer, Director of Global Macro for Fidelity Management & Research Company points out that earnings estimates are no longer advancing as they were earlier in the year and the price-to-earnings ratio is relatively high. Mr. Timmer believes that the market will be more focused on federal spending and tax policy.
Slow Growth – I Don’t Think We’re in Kansas Anymore
The U.S. Census Bureau estimates in U.S. Population Projected to Begin Declining in Second Half of Century that the “low-immigration scenario is projected to peak at around 346 million in 2043 and decline thereafter, dropping to 319 million in 2100.”
Investing in a Slow Growth World by Fidelity Viewpoints (September 25, 2024) describes the view of Fidelity’s Asset Allocation Research Team (AART) for investing over the next 20 years, “the favorable trends of past decades may be giving way to a new environment of slower growth, increasing geopolitical risk, and declining globalization in which investors may want to reconsider where they seek opportunities. They conclude, “those investors whose portfolios are well diversified across a broad, global opportunity set may be best positioned to take advantage of future growth, slower though it may be.”
The Congressional Budget Office produced An Update to the Budget and Economic Outlook: 2024 to 2034 in June 2024. The CBO estimates that real GDP (adjusted for inflation) will be 1.7% to 1.8% between 2026 to 2034. The CBO estimates the cumulative deficit for the 2025–2034 period is projected to equal 6.2 percent of GDP. To finance this debt, the debt to GDP will rise to 122 percent of GDP at the end of 2034. The interest rate is estimated to be 3.3% to 3.5% during this ten-year period.
Vanguard – Shifting into Low Gear
In the short-term, Vanguard Perspective: Active Fixed Income Perspectives Q4 2024: Temperature Check states, “With strong growth and a proactive Fed, the risk of a U.S. recession next year remains low, a sentiment reflected in market prices. We remain constructive on credit but conscious of expensive valuations and possible downside risk.” Over the long term, starting yields have consistently been reliable indicators of fixed-income returns.
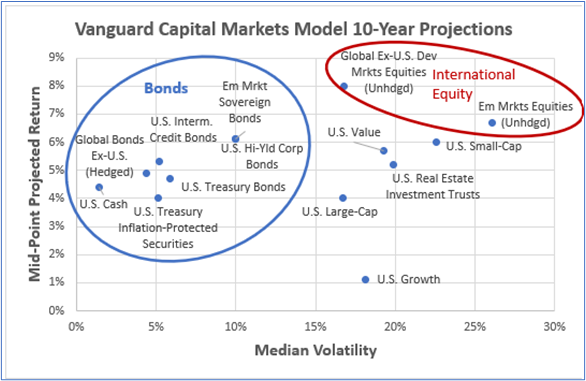
I created Figure #3 from Vanguard Perspective (October 22, 2024) to represent projected 10-year nominal return and volatility based on their June 2024 running of the Vanguard Capital Markets Model (VCMM). I find riskier fixed income and international equity to be attractive relative to domestic large company equity.
Figure #3: Vanguard VCMM 10-Year Return vs Volatility Projections
Source: Author Using Vanguard Perspective (October 22, 2024)
Valuations – Seeking Shelter
Value investor Warren Buffett is famous for the Buffett Indicator which divides the total stock market capitalization by gross domestic product. It is currently at the highest level since 1975. Berkshire Hathaway has been selling stock and according to the Third Quarter Report, now has $325 billion in cash, cash equivalents, and short-term investments in U.S. Treasury Bills out of a portfolio of $1,147 billion (28%).
Mr. Easterling (Crestmont Research) uses the historical relationship of EPS and GDP to normalize the price-to-earnings ratio. He concludes in The P/E Summary, “The current valuation level of the stock market is above average, and relatively high valuations lead to below-average returns.”
The Columbia Thermostat Fund is a twenty-one-year-old fund of funds that adjusts its allocation to stock based on the level of the S&P 500 to reflect valuations. The Fact Sheet as of the end of September shows that it had thirty percent allocated to stocks down from fifty percent in May of this year reflecting rising valuations.
Natalia Kniazhevich and Alexandra Semenova wrote ‘Dr. Doom’ Nouriel Roubini Warns of Trump Win Spurring Stagflation Shock. Dr. Roubini is well known for recognizing the early signs of the 2007 – 2009 financial crisis. He said that Trump’s policy plans of higher tariffs, devaluing the US dollar, and tough stance on illegal immigration threaten to slow down the economy and simultaneously spur inflation higher. Dr. Roubini recommends holding gold, short-term duration bonds, and Treasury inflation-protected securities.
1966 – 1982 SECULAR BEAR MARKET
Setting: The 1966 – 1982 secular bear market covers part of the civil rights movement, President Lyndon Johnson’s War on Poverty and Great Society, Women’s Liberation Movement, the 1968 Vietnam bear market, Nixon ending the convertibility of the dollar to gold in 1971, 1973 OPEC oil embargo, easing of tensions with Russia and China, Supreme Court decision in Roe v. Wade, Watergate and President Richard Nixon’s resignation in August 1974, Iranian hostage crisis, and stagflation.
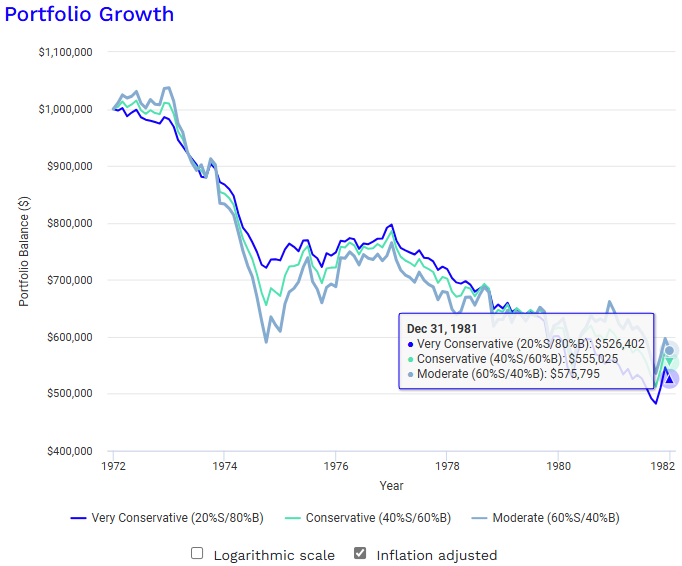
Investment data back to 1970 is limited. I set up Portfolio Visualizer for three portfolios starting with one million dollars in 1972 and 4% withdrawals spread monthly as shown in Figure #4. Allocations to the US Stock Market range from Very Conservative with 20% to Moderate with 60%. All three model portfolios ended with over $1.2 million nominal dollars at the end of 1981, but with less than $600,000 when adjusted for inflation. The purchasing power of withdrawals in 1981 were more than 40% lower than in 1972. Allocating 10% to gold equity instead of stocks would have improved the inflation-adjusted returns over the ten years by approximately 25%.
Figure #4: Inflation Adjusted Growth of Portfolios with 4% Withdrawals
Source: Author Using Portfolio Visualizer – Backtest Asset Class Allocations
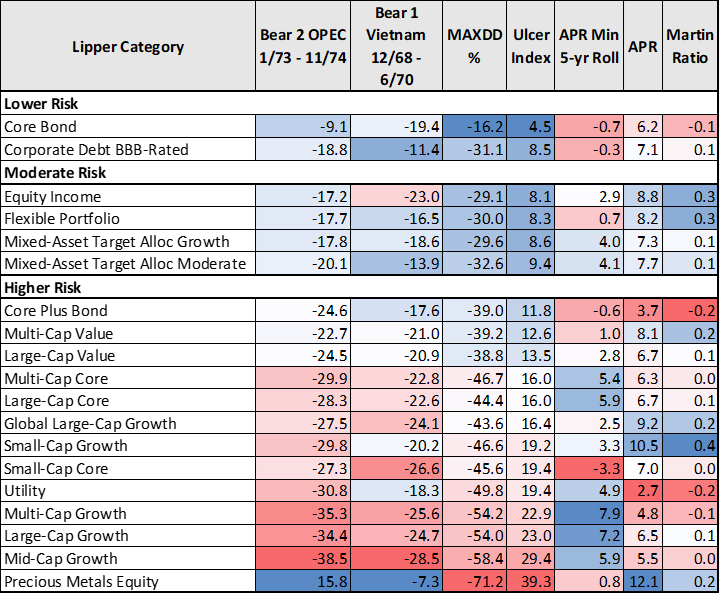
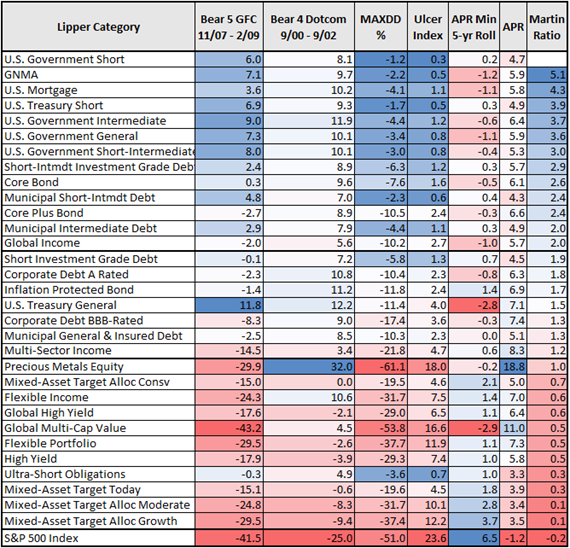
There are 96 mutual funds still in existence since 1964. The data in Table #1 covers the October 1964 to September 1974 time period. Fixed income performed as well as stocks but without the major drawdowns inflicting anxiety. Mixed-asset funds that benefited from rebalancing also performed well. Precious metals equity did the best for total return but with much higher volatility.
Table #1: Lipper Category Metrics for October 1964 to September 1974
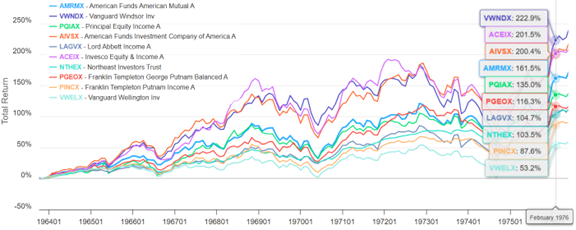
Figure #5 shows representative funds from the 1966 – 1982 secular bear market.
Figure #5: Representative Fund Performance (1966 – 1982)
2000 – 2016 Secular Bear Market
Setting: The 2000 – 2016 secular bear market began with the bursting of the Dotcom Bubble, technology advanced in smartphones, social media, and the internet, China and India developed into economic powers, 9/11 attack, War in Afghanistan started in 2001, the euro becomes the currency of the European Union, Iraq war start in 2003, Housing and Financial Crises (2007), President Obama is elected as the first Black President (2009), Arab Spring (2010), United States and Russia signed a treaty in Prague to reduce the stockpiles of their nuclear weapons (2010); United States, China, and Russia increase military spending; Quantitative Easing (2008-2014).
Table #2 shows the performance of Lipper Categories during the 2000s decade. Fixed income performed well. Precious Metals Equity again performed well but with high downside risk.
Table #2: Lipper Category Metrics for January 2000 – December 2009
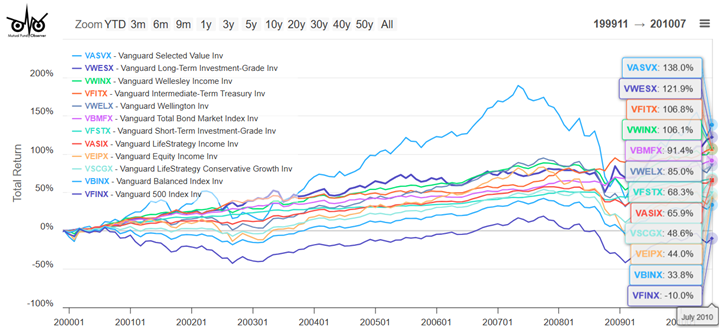
Figure #6 shows how representative Vanguard funds performed. Bonds and actively managed mixed-asset funds performed well.
Figure #6: Selected Vanguard Fund Performance (2000 – 2010)
STRATEGY FOR THE NEXT SECULAR BEAR MARKET
My outlook matches those cited in this article and I believe the risk of a secular bear market starting before the end of this decade is fairly high. I expect a “soft landing” for the current rate easing, and barring any shocks, the stock market should do moderately well next year or possibly the next. I expect that deficits will continue to rise and the national debt to increase. Interest rates will stay higher for longer. I advocate for people to work with financial advisors to develop long-term plans based on spending needs.
If a secular bear market materializes, I will adjust my spending down and re-invest required distributions from a Traditional IRA into after-tax accounts. I set up appointments with financial advisors to begin taking withdrawals from aggressive Traditional IRAs while the stock market is still high and to reduce withdrawals from more conservative Traditional IRAs. I follow an accelerated withdrawal strategy to avoid high taxes later in retirement.
I switched from a total return approach to investing for income in conservative Traditional IRAs. I maintain diversified bond funds in these accounts, but increased allocations to moderately riskier actively managed bond funds including Vanguard Global Credit Bond (VGCIX), Vanguard Intermediate-Term Investment-Grade (VFICX), and Vanguard Multi-Sector Income Bond (VMSIX). I also purchased Fidelity Advisor Strategic Income (FADMX/FSIAX).
Enjoy a safe and happy holiday season!
