
My largest holding by far is an actively managed, total stock market fund of funds with a tilt toward large-cap growth stocks. According to multpl.com, the Price-to-earnings ratio of the S&P 500 is 28.5 which is 50% higher than the average of 19.8 since 1970 and higher than 80% of the years since 1970. Table #1 shows the price-to-earnings ratio of Vanguard sectors and style exchange-traded funds. While most sectors are historically high, the P/E of the Information Technology sector is particularly concerning at 50% higher than the S&P500. Warren Buffet is the CEO of Berkshire Hathaway, a highly diversified value-oriented company (P/E 12 TTM), which I am considering buying to tilt a portion of my portfolio toward value.
Table #1: Equity Lipper Category Momentum

Source: Author Using Yahoo Finance
In this article, I take a look at economic growth and valuations and compare the Berkshire Hathaway stock to value-oriented mutual and exchange-traded funds. This article is divided into the following sections:
COMPARING BERKSHIRE HATHAWAY PERFORMANCE TO FUNDS
This article was inspired by conversations with Financial Advisors to move a portion of my portfolio into individual stocks. First, I don’t want to be actively trading stocks. Secondly, I want to keep things simple and not replicate some large index. Third, I want to tilt a portion of my portfolio toward value. And finally, I want to keep ordinary income from dividends low for tax efficiency.
Growth funds have risen faster during the good times such as now, and have fallen harder during the bad times. Figure #1 shows the five-year performance of the S&P 500 (blue line), Vanguard Growth (green line) and Value Fund (orange line) and Berkshire Hathaway (BRK.B, red and green bars), along with the First Trust Morningstar Dividend Leaders Index Fund (FDL, red line). My preference is to start locking in the gains by tilting away from growth toward value. Berkshire Hathaway has fared better than the value funds over the past five years.
Figure #1: Prices of Berkshire Hathaway, S&P 500, Growth, and Value Funds
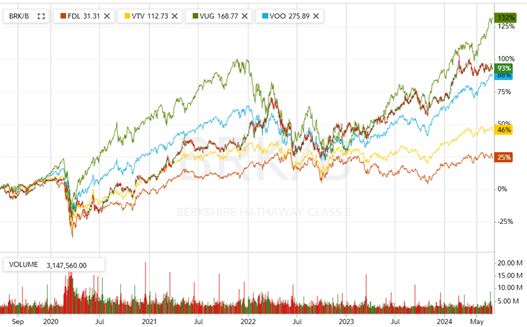
Source: Author Using Fidelity
Table #2: Metrics of Berkshire Hathaway, S&P 500, Growth, and Value Funds

Source: Author Using Fidelity
I extracted the mutual and exchange-traded funds with below-average valuations, moderate volatility, and high returns as shown in Figure #2.
Figure #2: Top Performing Funds with Below Average Valuations
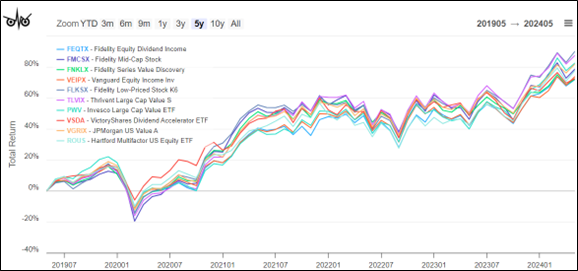
Source: Author Using the MFO Premium MultiSearch Tool
I then compared two of the best ETFs to the Berkshire Hathaway stock for the past ten years. Over the past ten years, Berkshire Hathaway has had returns close to the S&P 500 and above the value funds.
Figure #3: Berkshire Hathaway, Fidelity Equity Income, Invesco Large Cap Value Returns
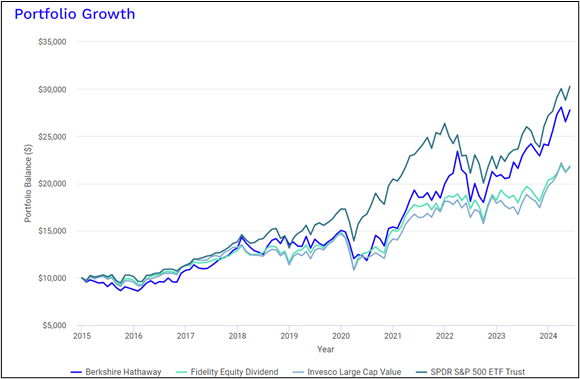
Source: Author Using Portfolio Visualizer
ECONOMIC WATCH – SAHM’S RULE
Key Point: The economy continues to slow in the late stage of the business cycle with the risk of a recession still on the horizon.
Soft landings following high inflation and major rate hikes have not been achieved in modern history in the US. They are rare even in milder conditions. An article by Jeff Cox at CNBC describes Sahm’s Rule which Chief Economist Claudia Sahm at New Century Advisors developed for predicting recessions. The premise is that when the unemployment rate’s three-month average is half a percentage point higher than its 12-month low, the economy is in recession. My baseline is not recession,” Sahm said. “But it’s a real risk, and I do not understand why the Fed is pushing that risk. I’m not sure what they’re waiting for.”
On the labor front, the 4-Week Moving Average of Initial Claims has started creeping up this year, the Unemployment Rate has risen to 4%, Hours Worked for All Workers (Business Sector) have stagnated since last year. Temporary Help Services (All Employees) has been dropping showing that businesses are preparing for a slowing economy.
Real GDP grew 2.5% in 2023 and the Second Quarter 2024 Survey of Professional Forecasters by The Federal Reserve Bank of Philadelphia shows estimated Real GDP Growth falling from 2.5% in 2024 to 1.9% in 2025 and 2026. The Federal Reserve Bank of New York uses the difference between 10-year and 3-month Treasury rates to estimate that the probability of a recession through 2024 and to May 2025 mostly remains above 50%.
The economy has remained surprisingly resilient with high interest rates due in large part to pandemic-era spending which is ending and savings which have been partly depleted. There are warning signs on the horizon such as Delinquency Rate on Credit Card Loans which has risen to 3.2% – just short of the 3.7% average since 1991. Real Retail and Food Services Sales, Total Business Sales, Industrial Production, Capacity Utilization, Commercial and Industrial Loans, and Real Disposable Personal Income have been stagnant or even declining since January 2023 or longer.
The Consumer Price Index for All Urban Consumers (All Items in U.S. City Average) declined to 3.3% in May and the Personal Consumption Expenditures (Chain-type Price Index) declined to 3.3% in May. According to Christopher Rugaber at the Associate Press, “Federal Reserve officials said Wednesday that inflation has fallen further toward their target level in recent months but signaled that they expect to cut their benchmark interest rate just once this year… The policymakers’ forecast for one rate cut was down from their previous projection of three cuts, because inflation, despite having cooled in the past two months, remains persistently above their target level.”
LOOKING UNDER THE HOOD OF EQUITY FUNDS
Last month, I wrote Fund Family Performance for Equity ETFs for the Mutual Fund Observer newsletter which identified ten Fund Families that had a high percentage of their equity funds that outperformed their peers for the past three years. This month, I extracted fifty-eight of those funds that have outperformed from those families to see what stocks they hold in the top ten holdings. The Top Ten Holdings contain 84 stocks of which 41 have at least 5% of the total allocation within the top ten. Thirteen of the funds own shares of Berkshire Hathaway.
Sixty percent is allocated to the Software, “Semiconductors & Semiconductor Equipment”, “Interactive Media & Services”, and “Technology Hardware, Storage & Peripherals Industries” sectors. The average Price to Earnings Ratio of all of the stocks is 29 while the average Price to Earnings Ratio in the preceding four industries is 39.
I experimented with the Fidelity Stock Screening Tool and one of the options to use is the Equity Summary Score from StarMine from Refinitiv:
StarMine from Refinitiv’s sophisticated scoring system facilitates a fair comparison of firm recommendation performance across widely disparate industries and market conditions. StarMine from Refinitiv uses recommendations from research providers and the past performance of their recommendations at the sector level to create a quantitative metric, the StarMine from Refinitiv Relative Accuracy Score, for a given stock.
Figure #4 shows the Equity Score from StarMine from Refinitiv for the 84 stocks in the Top Ten Holdings of the outperforming funds. It appears that momentum is driving valuations even higher. My preference is to look for a subset with low valuations.
Figure #4: Equity Score from StarMine from Refinitiv for Stocks in Top 10 Holdings
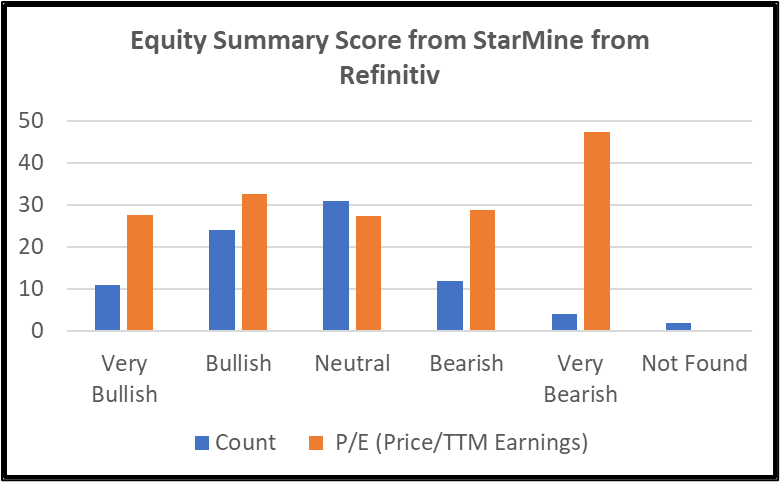
Source: Author Using the MFO Premium MultiSearch Tool and Fidelity Stock Screener
Berkshire Hathaway
Berkshire Hathaway is the only large company in the Multi-Sector Holdings Sub-Industry of the Financial Services Industry. Berkshire Hathaway has a market capitalization of $535 billion. To understand Berkshire Hathaway, let’s take a look at its investments, management philosophy known as the “Owner’s Plan”, and succession plan.
“List of assets owned by Berkshire Hathaway” at Wikipedia describes seventy-one companies for which Berkshire Hathaway owns wholly or controls a majority of voting shares, and fifty U.S.-listed public company and ETF holdings. “As of March 31, 2024, Berkshire Hathaway had $28.9 billion in cash and cash equivalents and $153.4 billion in short-term investments in U.S. treasury bills.”
According to Wayne Duggan in “Largest holdings in the Warren Buffett portfolio” at USA Today, “Among the 47 stocks Berkshire Hathaway holds, the top 10 represent about 84% of the company’s holdings.” The top 10 are Apple (AAPL), Bank of America (BAC), American Express Co. (AXP), Coca-Cola Co. (KO), Chevron (CVX), Occidental Petroleum (OXY), Kraft Heinz (KHC), and Moody’s Corp. (MCO).
Mr. Buffett laid out his “Owner’s Manual” for Berkshire Hathaway in 1999 which I summarize:
- Although our form is corporate, our attitude is partnership…
- In line with Berkshire’s owner-orientation, most of our directors have a major portion of their net worth invested in the company. We eat our own cooking.
- Our long-term economic goal (subject to some qualifications mentioned later) is to maximize Berkshire’s average annual rate of gain in intrinsic business value on a per-share basis…
- Our preference would be to reach our goal by directly owning a diversified group of businesses that generate cash and consistently earn above-average returns on capital…
- Because of our two-pronged approach to business ownership and because of the limitations of conventional accounting, consolidated reported earnings may reveal relatively little about our true economic performance…
- Accounting consequences do not influence our operating or capital-allocation decisions…
- We use debt sparingly and, when we do borrow, we attempt to structure our loans on a long-term fixed-rate basis…
- A managerial “wish list” will not be filled at shareholder expense…
- We feel noble intentions should be checked periodically against results…
- We will issue common stock only when we receive as much in business value as we give…
- …Regardless of price, we have no interest at all in selling any good businesses that Berkshire owns…
- We will be candid in our reporting to you, emphasizing the pluses and minuses important in appraising business value…
- Despite our policy of candor, we will discuss our activities in marketable securities only to the extent legally required…
Troy Segal describes Warren Buffett’s planned successor in “Greg Abel: Warren Buffett’s Successor’s Life, Salary, and Accomplishments” at Investopedia. Mr. Buffett’s role will probably be divided into several parts with Gregory Abel becoming the CEO of Berkshire, and Buffett’s son Howard likely to be named Berkshire Chair of the Board. Canadian-born Gregory Abel (62) joined Berkshire Hathway in 2000. Mr. Abel was appointed to the Berkshire Hathaway board of directors in 2018. He “oversees all of Berkshire’s railroad, auto utilities, manufacturing, and retail subsidiaries—over 90 companies in all.”
In summary, Berkshire Hathaway invests for the long term using a value strategy. It is diversified with a good long-term track record. It has the cash available to make acquisitions at lower prices if a recession becomes more likely.
Closing
The next six months will provide clarification on the economy, inflation, and interest rates. I have another meeting with Financial Advisors to discuss possibly using personalized portfolios in managed accounts. Of the accounts that I manage, I am interested in being more value-oriented in a tax-efficient manner. I have several stocks and value funds on my short list, and at this point, I am leaning toward Berkshire Hathaway.