
Our colleague Devesh Shah has been in search of a reason to have any direct international exposure. That is, for an answer to the question, “Why should I invest one cent in an international equity fund?” He notes that the default for many endowment portfolios is 18% international, but that – over the course of the 21st century so far – the actual efficient frontier portfolio held only 5% international equity.
International stocks are 40% of the total global capitalization. They are 18% of an endowment’s target. But should they actually be a 5% squidge? The problem is multiplied if you choose to invest in a traditional, passive cap-weighted fund or ETF. While indexing has excelled as a strategy for most domestic equity categories, it has been a consistent deadweight globally.
At the end of the day, Devesh has conviction in just two managers: David Samra (and Ian McGonigle) at Artisan International Value, which is closed, and Amit Wadhwaney at Moerus Worldwide Value. Most of the others have been some combination of low-returning and low consistency.
We decided to cast a broad net to identify funds that have consistently earned their keep and their place in your portfolio. Our screen started with all international equity funds – developed and developing, diversified and single country or region. We winnowed that list down to only those funds that were designated as Lipper Leaders (MFO uses the Lipper global data feed) for the past three years, five years, ten years, and since inception. That’s a group of 55 funds.
We then sorted those funds based on their 10-year Reamer Ratio. There are many standard, and some innovative, ways to gauge the risk-return tradeoffs that every investment offers. MFO Premium, our data site and screener for which Charles Boccadoro is the maestro offers a wide range of customizable measures to answer the question, “But how did it really do?” Those have sometimes been developed in partnership with financial planners who use them to help their clients navigate uncertain markets and anxious times.
The Reamer Ratio is named after Brian Reamer, a Wisconsin-based financial adviser, who uses it to help assess fund performance consistency. Specifically, it is the percentage that a fund’s 3-year rolling returns beat the rolling returns of its category peers over the past 10 years. Rolling 3-year periods would be January 2013 – December 2015, then February 2013 – January 2016, and so on. There are 85 such 3-year periods per decade. A score of 100 means that a fund beat its peers in 85 out of 85 periods.
We provide three other bits of consistency-related information.
The minimum 3-year roll is the fund’s performance in the single worst one of those 85 three-year periods: it’s sort of a long-term investor’s worst-case experience.
The average three-year roll shows the average annual return for an investor holding for three years, which eliminates the effects of short-term spikes and drops in performance.
Great Owl funds, whose names appear in blue, are MFO’s elite: A fund that has delivered top quintile risk-adjusted returns in its category for the past 3-, 5-, 10-, and 20-year periods, as applicable.
Got it? Columns one and two show how much you earned annually, over the past 10 years, and how that compared to its peers. Then how consistently did you win measured by three-year holding periods. Blue font: Great Owl. We marked the best performances with blue highlighting, for ease of scanning.
The gold standard is Artisan International Value, which has almost unbeatable performance.
Almost.
 The one active international fund with the strongest case for consideration is Buffalo International which, like Artisan, won 100% of the time but had slightly higher returns and a better worst-case. We will write more about Buffalo in August, but here’s the fifty-cent summary from Nicole Kornitzer, Portfolio Manager and daughter of Buffalo’s founder:
When it comes to investing internationally, we believe our approach to stock selection is distinct. We are focused on finding good companies and aren’t constrained by benchmark alignment to countries or industries.
Our approach is based on finding companies with sound business models, exposure to long-term secular growth trends, and attractive risk/return growth and valuation characteristics, which we can own for the long term.
It’s a four-star, $1.1 billion fund whose portfolio holds about 90 names (per Morningstar, 7/1/2024) with a glacial turnover ratio of 8%. Ms. Kornitzer has between $500,000 – $1 million invested in the fund.
The one passive international fund with the most striking performance is WisdomTree International Hedged Quality Dividend Growth ETF. They screen approximately 2,000 international, developed market stocks to identify the top 300 companies with the highest return on equity, ROA, and forward-looking earnings growth. They then fully hedge their currency exposure. It’s a five-star, $2.7 billion fund whose portfolio holds about 250 names (per Morningstar, 7/1/2024) with a brisk turnover ratio of 86%. None of the five managers have chosen to invest in the fund.
Based on those criteria, and excluding funds unavailable to neither retail investors or regular financial advisors, here are the most consistently successful international funds and ETFs for the past decade.
The Most Consistent Winners, 2013-2024
| Lipper Category | Annual return | APR vs Peer | Reamer Ratio | Minimum 3-yr Roll | Average 3-yr Roll | |
| Buffalo Int’l | Int’l Multi-Cap Growth | 7.3% | 2.4 | 100% | 0.7% | 9.2% |
| Artisan Int’l Value (cl0sed) | Int’l Large-Cap Value | 7.1 | 3 | 100 | -4.1 | 7.6 |
| MFS Int’l Equity | Int’l Large-Cap Core | 6.6 | 2.1 | 100 | 0.8 | 7.9 |
| Allianz PIMCO StocksPLUS Int’l (US Dollar-Hedged) | Int’l Multi-Cap Core | 8.9 | 4.5 | 96.5 | -1.3 | 8.6 |
| American Funds New World | Emerging Markets | 5.3 | 2.8 | 96.5 | -2.5 | 7.4 |
| WisdomTree Int’l Hedged Quality Dividend Growth | Int’l Equity Income | 9.5 | 5.8 | 95.3 | 2.9 | 9.6 |
| iShares Currency Hedged MSCI EAFE ETF | Int’l Large-Cap Core | 9 | 4.5 | 95.3 | -0.2 | 8.4 |
| Xtrackers MSCI EAFE Hedged Equity ETF | Int’l Large-Cap Core | 8.9 | 4.4 | 95.3 | 0.1 | 8.2 |
| Virtus KAR Emerging Markets Small-Cap | Emerging Markets | 6.2 | 3.7 | 94.1 | -2.8 | 8.6 |
| Brown Advisory WMC Strategic European Equity | European Region | 7.3 | 2.6 | 89.4 | -1.3 | 7.4 |
| Fidelity Int’l Capital Appreciation | Int’l Large-Cap Growth | 8.2 | 2.7 | 88.2 | -1.1 | 8.8 |
| Janus Henderson Responsible Int’l Dividend | Int’l Equity Income | 6.3 | 2.6 | 87.1 | -0.7 | 5.9 |
Source: MFO Premium. A spreadsheet with additional metrics is available for download.
How do we explain the winners? That is, what do they have in common that might help explain their success and guide our choices?
- Almost all of the managers are vocally risk-conscious. Samra describes “a focus on risk management” as one of the three pillars of his process. MFS professes “A risk-aware culture where risk plays a central role in decision-making and everyone takes responsibility for assessing it.” The passive funds, of course, weren’t.
- Almost all of the managers use the terms “quality companies” and “sensible valuations.” Some use the term explicitly, as when Fidelity’s manager notes “Our investment approach seeks to identify high-quality growth stocks.” Others focus on the markers of a high-quality firm – high and consistent free cash flow, low leverage, consistent revenue growth – without invoking the term directly.
- Absolutely all of the funds and ETFs actively hedge their currency exposure. As the US dollar increases in value, earnings generated in other currencies decrease. In June 2008, if you had one Euro in earnings, it translated to $1.58 here. In June 2024, if you had one Euro in earnings, it was worth $1.07. Because of the effect of currency fluctuations, your European company needed to increase earnings by 50% just to offset the effects of the strengthening dollar.
Tweedy, Browne runs one international value portfolio, but it makes it available in two packages. International Value (ticker TBGVX, in red below) hedges its currency exposure. International Value II (TBCUX, in blue) does not. Over ten years, the same $10,000 investment in the same strategy with the same managers would have grown by either $3,161 or $5,587.
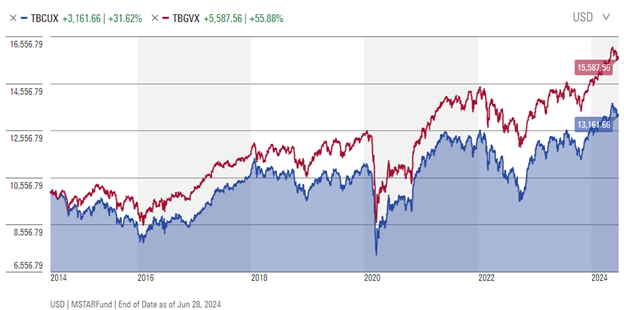
Here’s an argument for active management: active managers have the option of hedging their currency exposure; passive ETFs have the obligation to do so. That’s good if the dollar is rising, but bad if the dollar is falling. In a falling dollar regime, the names on the red and blue lines above would have been reversed and the hedged portfolio would have trailed its unhedged clone by about 18%.
Why worry about a falling dollar? Start with the question, “Why would anyone in France or China want to own dollars?” There are two primary answers because (1) they want to buy OPEC oil which is traditionally priced in dollars and (2) they want to buy US Treasury bonds, also priced in dollars. If oil demand dwindles or if OPEC begins accepting Euros or if foreigners look at a completely unrestrained federal deficit or US national debt as say “non, merci,” the dollar falls.
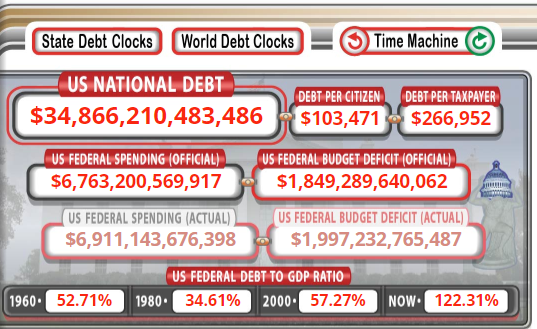
Source: USDebtClock.org