
Step One: Find the right recipe.
Indexes are recipes. By that, I mean they’re really precise sets of instructions that direct you in what ingredients, in what amounts, need to be treated, in what way to achieve a particular, predictable outcome. In investing, as in cooking, recipes are relatively recent inventions. Once upon a time, both activities were dominated by the notion that “experienced old guys do their thing, the rest of us watch in awe.”
Take luce or tench or fresh haddock, & boil them & fry them in olive oil. And then take vinegar and the third part sugar & onions minced small, & boil all together, & mace & cloves & cubeb. And lay the fish in dishes & pour the sauce above & serve it forth.
How much luce or tench or haddock, boiled and fried (?) for how long? With cubeb? Uhhh … The problem was clear: it required a lot of trust, failed often, and couldn’t be explained even when it succeeded. Recipes explained how a particular dish was prepared, though that didn’t automatically make the dish good. Just predictable. Peanut butter and jelly macaroni? It is a thing. Easy to make. And not good.
A cold Salty Dog? Easy to make, quite good.
And so, cooks began experimenting, codifying, and testing. The goal was predictably, consistently good results – sacrificing the occasional bit of genius to avoid the more than occasional “well, it sounded like a good idea at the time” moments.
Investing, likewise. Indexes are created by recipe and offer predictability in lieu of accidents, happy or not.
I had these recipes that say do this, do that. Who MAKES these rules? Emeril Lagasse
MSCI, mostly, Emeril. MSCI calculates around 160,000 investable indexes. Each is a set of instructions for enacting a different investment recipe, though many of the recipes are variations.
Soon after Russia invaded Ukraine, and it closed its stock market, a question was raised about how index funds would handle Russian stocks. The short answer was that index funds track indexes, so it depends on what the index does. That is why this piece is about indexes as opposed to index funds.
Below, I will describe what indexes are and how they’ve changed. That will be followed by a discussion of what goes into an index. Next is a brief example of how markets are segmented. No section does more than touch the surface. The intent is to provide a sense of what indexes are and the underlying complexity of what, at first blush, seems very simple. The bottom line is that understanding the objective and construction of indexes can help in choosing which index in a given space best matches your perspective and meets your needs.
1. A description of indexes
There doesn’t seem to be an official or universally accepted definition of an index. Instead of putting a stake in the ground, we can take a brief look at how the meaning or use of indexes has changed.
1a. Basic role of indexes
Traditionally, an index is a measurement or calculation of an average or typical “something.” That something could be an attribute of the environment, like the temperature-humidity index (THI). Or it could be something that affects our pocketbook, like the consumer price index (CPI). Or what is most important for readers here, it could be the performance of an investment market.
Such indexes are largely indicators, not necessarily precise figures. When the government reports that the CPI has risen 7.9% in the past year, it is not saying that everyone has seen their expenses go up by that amount. It’s a typical figure, determined by averaging the types of items that people purchase, and at average prices.
That’s what Charles Dow did in the late 1800s when he constructed the first indexes, the Dow Jones Railroad Average (now the Dow Jones Transport Average) and the Dow Jones Industrial Average. He selected representative stocks that could be used to gauge the overall performance of the economy.
This was more a window into financial markets than into the economy, which is viewed only indirectly. These days we have better indicators for the economy, such as GDP and employment figures. As the stock market and economy grew in the 20th century, the sampling size of his indexes was increased, first from twelve to twenty by 1916 and to its current thirty in 1928.
An obvious question is what amount of sampling is necessary to give a good indication of the stock market as a whole? Enter other indexes. Standard & Poor’s (then Standard Statistics Company) introduced its first stock index with 233 stocks in 1923. That gradually grew into the better-known S&P 500 Composite Index. Back when the S&P 500 started in 1957, it covered 90% of the value of NYSE-traded stocks. So it could serve as a reasonable index for the whole market. Even now, S&P writes that “The S&P 500 is highly regarded as a proxy for the U.S. equity market”. Though today it is better taken as a proxy for the large-cap segment of the market.
It’s not just the size of the sample that matters, but what is being sampled. Taking a broad sample is why the S&P 1500, the Russell 3000, and the Wilshire 5000 can all serve as reasonable indicators for the whole U.S. market, though each misses various small corners of the market.
1b. Indexes as benchmarks for funds
For a long time, there wasn’t much difference between defining the market as the total value of all stock companies and defining the market as the total value of stock one could actually buy on the open market. (This is commonly referred to as free float.)Two factors came together to change this.
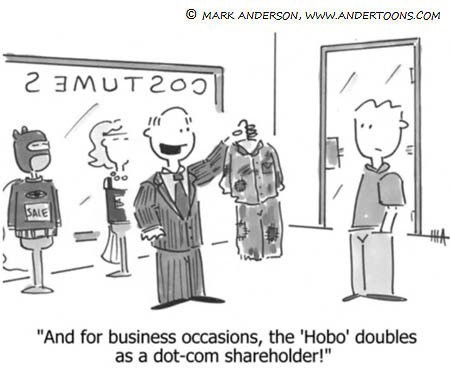
One was the increasing use of the market by dot.com companies in the 1990s. They would sell only small portions of their stock in IPOs. High demand for these stocks could, and did, distort prices. Some of that demand came from index funds. Originally small when created in the 1970s, index-tracking investments grew to the point where they could affect small companies that were selling only a small percentage of their stocks.
Index providers responded by changing how they weighted companies. They moved away from the more economy-oriented practice of weighting companies by their total value and toward the more investment-oriented practice of weighting companies by the amount of investible stock they had outstanding. First, FTSE (1999), then MSCI (2000), and S&P (2004), these providers and others changed over to indexing investible markets.
What one sometimes reads is that the change in market definition to investible market was because investors want to know how they can expect their investments to perform. So they only want to know about the shares they can invest in. This has some superficial appeal but may ultimately strike one as unsatisfying. The impact of a company on the economy (harkening back to an original purpose of indexing) depends on the size of the company, not the percentage of its stock in circulation.
Weighting by investible stock value rather than outstanding stock value has its own potential for distortions. A CEO with restricted stock could at some point dump those shares and suddenly, substantially increase the number of investible shares in the market. While I accept the wisdom of the entire industry shifting over to free float, that does not come without its own set of issues.
Right before S&P converted to free float for its domestic indexes, it put out a paper explaining why it was hesitant to do so. It addressed the liquidity issue – difficulty in indexes tracking companies with low float percentages – by noting that it already excluded low liquidity companies from its indexes. It also made mention of how indexes are supposed to be barometers of an entire market, not just the investible portion. Call it confirmation bias, but it was nice to run across this piece.
Another change that index providers made to accommodate index funds was the introduction of buffers. If one wanted to construct a large-cap index, originally, one would just include all companies larger than a given size and exclude all smaller companies. While that’s a solid, clean approach, it has the potential for creating churn in index funds. A company sitting on the boundary might be included in an index for one period but then excluded in the next. This could go on repeatedly with multiple companies.
To reduce the churn, index providers introduced the concept of buffers. A buffer is a region encompassing stocks from both sides of a dividing line. For example, if the dividing line between mid and large caps were $15 billion, then a buffer zone might range from $13 billion to $17 billion.
One way of using this buffer zone (as described by Gus Sauter) would be to leave a mid-cap company in the mid-cap index until it grew completely out of the buffer, i.e., attaining a market cap of $17 billion. An effect of this approach is that the classification of a company becomes path-dependent. It matters how the company got to where it is. Two companies with the same market cap could appear in different indexes. Engineers and physicists might recall hysteresis (effectively, lag).
Another way to use a buffer would be to gradually reduce the weight of a company in one index and increase it in another as it moves through the buffer. So our mid-cap company would have 100% weight in the mid-cap index until it grew to $13 billion in size. Between $13 billion and $17 billion, its weight would be prorated between the two indexes. Finally, at $17 billion, it would be weighted completely in the large-cap index. In actual practice, this type of buffering is generally used in dividing companies between growth and value, not between market cap categories.
2. Index components
Index providers use a large variety of factors to decide whether a company is eligible for indexing, in which market(s) it belongs, whether it is actually used in calculating an index value, and if so, what weight it is given. A few factors have already been introduced, including market capitalization, free float, liquidity, and growth/value.
2a. Eligibility for index inclusion
Eligibility only defines the market or universe that the index is measuring. When deciding which index one wants to track, how a provider defines stock eligibility may be an important factor to consider.
The providers often use the same criteria but with different values. For example, S&P requires a company to have at least 10% of its stock publicly available (free float) to be eligible for inclusion in its small-cap index (S&P 600). In comparison, Russell has just a 5% free float eligibility requirement for inclusion in the Russell 2000 index.
In addition, some providers may add criteria that some other providers don’t use.S&P requires companies included in the S&P 1500 (and by extension, the S&P 500, 400, and 600) to be “financially viable.” That is, the companies must have had positive GAAP earnings over the past quarter and over the past year. This tends to give S&P indexes a bit of a quality bias, especially in small caps where a greater percentage of companies may not be profitable. (S&P has no viability requirement for its total market index.)
2b. Actual inclusion in an index
Most index providers specify rigid rules for including companies in one of their indexes. For example, the Russell 3000E index contains the 4,000 largest eligible companies in the US., or all, if fewer than 4,000 companies are eligible. The Russell 3,000 is then the top 3,000 of these; the Russell 2,000 consists of companies 1,001-3,000, and so on.
Mechanical rules like these are unambiguous but can be subject to biases. Some sectors may tend to have smaller companies than others and thus get underrepresented this way. For example, in VRRTX (Vanguard’s Russell 3,000 index), only 2.17% of its portfolio is invested in basic materials, while in the total market, using VTI (Vanguard Total Stock Market ETF) as a proxy, basic materials represent 2.48% of the market.
Another approach is that taken by Standard and Poor’s. Regarding indexes as market indicators, it tries to select securities for inclusion that accurately represent the market as a whole. It has a committee of human beings to review index components and may remove a component for “lack of representation.” On the positive side, this can result in a better “barometer” of the market. In the S&P 1500, using SPTM (SPDR S&P 1500 ETF) as a proxy, basic materials represent 2.61% of the portfolio. This is a bit closer than the Russell 3000 allocation to the “true” value of 2.48%.
The downside of the human approach is that it may make wrong decisions. In December 2000, S&P decided that it needed to add “new economy” stocks to the S&P 500 and remove “old economy” stocks. Many people remember what happened next. Over the next twelve months after being replaced in the index in 2000, the deleted stocks returned 16.55% (median) / 21.77% (mean), while the replacement stocks returned -22.62% (median) / -24.88% (mean).
3. Segmenting the whole market
Markets can be sliced and diced in various ways – by market capitalization, by style (growth/value), sector or theme, country or region. Then there are alternative weightings. For example, equal weighting may be rationalized by asserting that what is being measured is stock mispricing which is equally likely on all stocks. So to measure this, all stocks must be weighted equally. Then there are “smart beta” indexes. At some point, these become active strategies in sheep’s clothing—a subject for another day.
This section will be limited to just one way of segmenting the market. Since we began with the question of Russian stocks, we can look at how providers define developing market indexes. It is instructive to compare how FTSE and MSCI view emerging markets.
FTSE has three categories of emerging markets: Advanced Emerging, Secondary Emerging, and Frontier. Classification is based on six different criteria, some with subparts. It’s a complex matrix, with factors including per capita income, regulatory environment, advanced trading features, accessibility to foreign investors, efficient clearing. FTSE created a fine-grained set of standards so that it could closely track each country’s progress.
Based on per capita income and on the size and sophistication of the Korean market, FTSE classified Korea as a developed country in 2009. It did this while acknowledging that foreign investors still faced some difficulties in investing in the country.
Russia had been classified as Secondary Emerging while also on a watch list for potential reclassification as an Advanced Emerging country. After sanctions were imposed on March 2, FTSE removed Russia from all its indexes. Russian stocks were no longer being traded, so very simply, they were ineligible for inclusion in any FTSE index.
MSCI handles emerging markets a bit differently. It has just one bucket for them, Emerging Markets. It classifies a country as emerging based on the country’s per capita income, size of its market, and accessibility of that market to foreign investors. It is because of that last factor that MSCI, unlike other index providers, classifies Korea as an emerging market.
If a country is in some important way unique, MSCI puts it into its own standalone index. Certainly, Russia’s situation is unique. MSCI reclassified Russia as a standalone market, effective March 9.
4. Conclusion
Indexes are primarily indicators of how a market or market segment is performing. How those markets are defined and measured varies significantly from provider to provider. The better one understands these differences, the better one can choose an index and an index fund that performs as one expects.