
UTI S&P BSE Low Volatility Index fund is the new factor index fund in town.
While it sounds counter-intuitive, we have seen earlier that less volatile stocks tend to do better than more volatile stocks.
There are many Low Volatility Indices.
- Nifty Low Volatility Index (picks 50 least volatile stocks from the NSE-listed stocks)
- Nifty 100 Low Volatility 30 (picks 30 least volatile stocks from Nifty 100)
- S&P BSE Low Volatility Index (picks 30 least volatile stocks from S&P BSE LargeMidcap)
Nifty 100 Low Volatility 30 picks from the universe of large cap stocks, the other two indices pick stocks from a much wider universe of stocks.
There is an ETF by ICICI tracking Nifty 100 Low Volatility 30 index.
UTI and Motilal Oswal have launched index funds/ETFs tracking S&P BSE Low Volatility index.
Which Low Volatility Factor Index is the best?
I would expect the performance to be similar. Still, let us compare.
We compare the performance (Total Returns index) from January 31, 2012, until January 31, 2022.

The S&P BSE Low Volatility Index is the best performer on all parameters.
Highest CAGR.
Lowest standard deviation.
Higher Sharpe ratio and alphas.
Highest 3-year and 5-year average rolling returns.


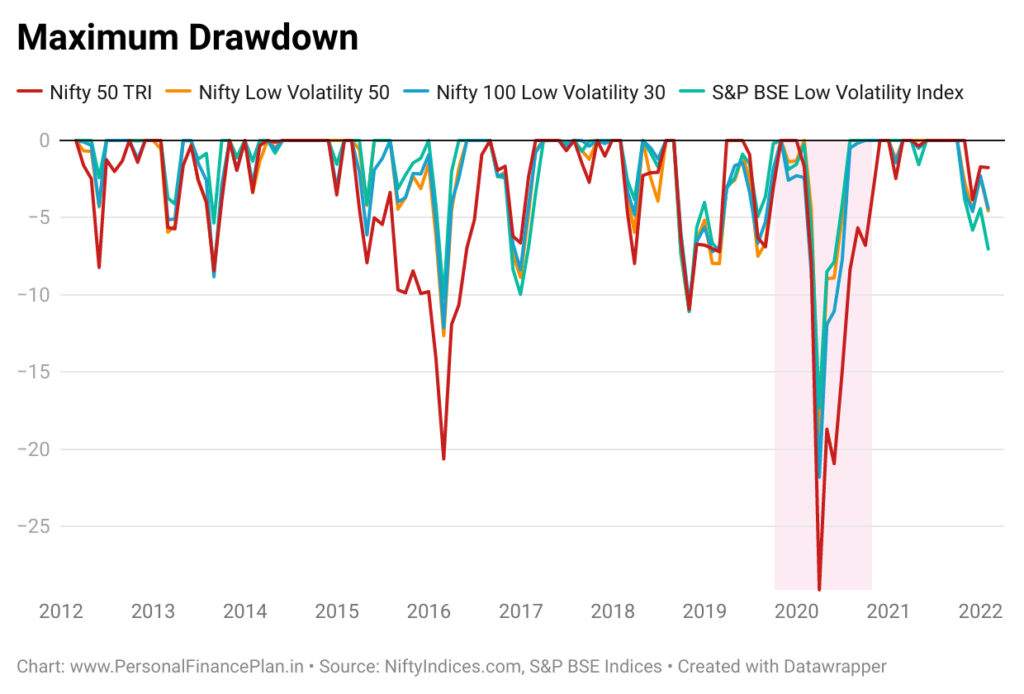
On the volatility front, you would expect Low Volatility indices to perform better than Nifty 50. And the indices do not disappoint. The drawdowns are lower too.

What about the live data?
Low volatility investing looks good. However, not all of this is live data. Data prior to the launch date is backfitted.
Here are the launch dates or various indices and the performance since launch.

As you can see, Nifty 100 Low Volatility 30 and S&P BSE Low Volatility indices have underperformed Nifty 50 since their launch. While these are point-to-point returns, 6 years is still a long time.
You can also look at the rolling returns charts (shared earlier in the post). With the live data, the lines are much closer to Nifty 50 (compared to back-fitted data).
Moreover, note these are Total Return indices. There will be tracking error. You can expect higher tracking error in Low volatility indices compared to Nifty 50. Even within low vol indices, I would expect higher tracking error in Nifty Low Vol 50 and S&P BSE Low Vol index (since the universe of stocks is broader).
Now, let us focus on other performance parameters than just returns (since July 31, 2016- January 31, 2022).

CAGR is lower than CAGR for Nifty 50. Alpha has come down sharply (compared to numbers since Jan 31, 2012). Has almost halved. However, these indices still deliver on their promise of low volatility. Despite lower returns, Sharpe ratio is higher than Nifty 50. Average 3-year rolling returns are higher despite lower CAGR. Lower drawdowns. Good
I like the Low Volatility factor. In my opinion, Low Volatility is the magic potion. Perhaps because junk stocks (which we have no dearth of) tend to be more volatile. And Low volatility filter simply removes such stocks.
However, we are demanding investors. Lesser volatility is fine but where are the better returns? And when you cannot beat Nifty 50 over 5-6 years, the investors will ask questions.
Low Volatility has NOT been an outstanding performer (returns), at least based on the live data. Perhaps, it delivers better when you mix low volatility with other factors. We have seen that in case of Alpha Low Volatility index and momentum indices.
Among the Low Volatility indices, S&P BSE Low Volatility index is a fine choice.
Additional Links
S&P BSE Factor Indices Methodology
Nifty 100 Low Volatility 30 Index
Nifty Factor Indices Methodology