
The Squeeze Momentum indicator, also known as the TTM Squeeze indicator, is a technical analysis indicator focused on identifying securities with likely breakouts after extended periods of low volatility.
The TTM squeeze indicator is a relatively new technical indicator introduced by John F Carter, a famous day trader.
The TTM squeeze indicator uses a combination of Keltner Channels and Bollinger Bands to compare average and current volatility, and a momentum oscillator to show price momentum.
What Is the Squeeze Momentum Indicator For?
The Squeeze Momentum indicator is designed to identify securities that are likely to soon break out of an extended period of sideways price action.
John Carter’s strategy is based on all securities eventually breaking out of periods of flat movement, so it is only a matter of identifying when that inevitable breakout will happen.
The Squeeze Momentum indicator tracks the average and current levels of volatility to see when the current volatility starts to exceed the average volatility.
This relative rise in recent volatility is a strong signal that a breakout in trend price movement is about to occur.
The higher the current volatility is compared to the average volatility, the more likely the breakout is to occur and the stronger the price moves are likely to be.
The momentum oscillator then adds valuable information on the price momentum to measure the intensity of the breakout.
Identifying breakouts in advance provides traders with an excellent opportunity to develop trades with very high returns and little risk.
A Breakdown of the Squeeze Momentum Indicator
The Squeeze Momentum indicator is composed of 3 parts.
The Keltner Channel and the Bollinger Bands interact to determine the level of the squeeze effect, and the momentum oscillator shows the price momentum.
Most platforms use a histogram to show the squeeze effect using dots or crosses instead of actually showing the Keltner Channel and Bollinger Bands.
Keltner Channel
The Keltner Channel is a volatility indicator that measures the average volatility of a security over a specified period of time.
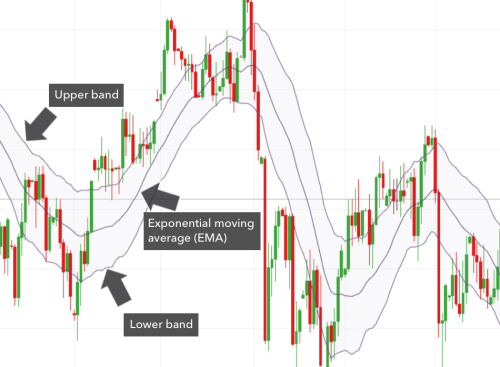
Keltner Channels are composed of 3 lines.
The center line is the exponential moving average (EMA), which is a moving average that places greater weight on the most recent data points.
The other two lines are 2 deviations of the average true range (ATR) from the center EMA line.
The ATR is a market volatility technical indicator that uses situational measurements to best represent a security’s historical volatility.
To best model the average volatility, the ATR uses whichever is highest:
- Current Price High – Current Price Low
- Current Price High – Previous Closing Price
- Current Price Low – Previous Closing Price
The ATR bands represent the historical volatility of the price from the EMA center line, giving a highly detailed image of the security’s overall average volatility.
Bollinger Bands
Bollinger Bands are a comparatively simple technical indicator invented by John Bollinger that shows a security’s current volatility.
John Bollinger created this measure for volatility to be visually intuitive to use, which makes it ideal for combining with other technical analysis indicators.
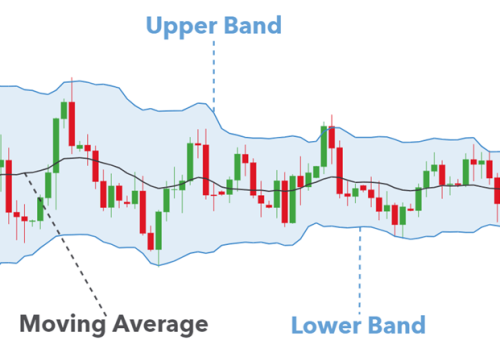
Bollinger Bands are typically set as 2 standard deviations from the simple moving average (SMA) of the security’s price.
The greater the volatility of the security, the further the Bollinger Bands will extend from the SMA.
Momentum Oscillator

Most versions of the Squeeze Momentum indicator also incorporate an additional indicator in the form of a momentum oscillator.
The momentum oscillator adds to the value of the TTM Squeeze indicator by showing the intensity of any price breakouts.
The momentum periods are indicated by a bar graph that rises and falls with the momentum of the price.
How to Use the Squeeze Momentum Indicator?
The TTM Squeeze indicator works by combining the information from the Keltner Channel with the information from the Bollinger Bands to demonstrate the squeeze effect.
The intensity of any breakout from a squeeze is then shown by the momentum oscillator bar graph.
When the Bollinger Bands are inside the Keltner Channel, that indicates that current volatility is within the bounds of historical volatility.
This indicates a flat movement for the price.
When the Bollinger Bands push outside the Keltner Channel, this indicates that current volatility is exceeding historical volatility.
When current volatility exceeds historical volatility (when the squeeze fires), a breakout is likely to happen.
The more the Bollinger Bands exceed the Keltner Channel, the more likely a breakout is to happen and the bigger the breakout is likely to be.
The momentum oscillator then provides supplemental information, showing how intense the price momentum is as the squeeze fires.
Histogram for the Squeeze

Since it would be too disorganized to show the Keltner Channel and Bollinger Bands, the squeeze effect of the TTM Squeeze indicator is instead shown on a histogram.
The squeeze effect is demonstrated by colored dots or crosses, generally red and green dots or a black cross for squeeze periods and a gray cross for squeeze release periods.
For illustrative purposes, we will use red and green dots.
When volatility is low and the squeeze is in effect, the histogram will show red dots.
When the squeeze release happens and volatility is high, the histogram will show green dots.
Use the Squeeze Momentum Indicator to Learn More
The best method for learning more about this popular indicator is by using it to make real or simulated trades.
Identifying potential breakouts from flat trend directions is one of the highest-return and lowest-risk financial market analyses that traders can make.
Traders who want to beat market trends are advised to incorporate this relatively simple momentum indicator into their toolkit.
TrendSpider is the highest-rated technical analysis software, offering the squeeze momentum indicator and many other technical indicators for users to enhance their market-beating trading strategy.