
Technical analysis is filled with complex indicators that seem overwhelming at first, but are actually easy to understand and use.
The TDI (Traders Dynamic Index) trading indicator is a good example of this trend in technical analysis.
Developed by Dean Malone, the TDI indicator combines a Relative Strength Index (RSI) with both its short-term and long-term moving averages to form a hybrid indicator.
This combination of momentum and market volatility trading signals provides a technical analysis indicator that is ideal for spotting securities that are overbought or oversold.
It takes a little effort to understand all this, but this popular indicator is an extremely effective part of any trader’s toolkit.
What Is the TDI Indicator For?
The TDI technical indicator offers a comprehensive analysis of a security’s momentum and volatility.
Momentum is a measure of sentiment, which traders use to gauge the market’s general bullish or bearish attitude toward a security.
Volatility is a measure of the price action of a security relative to some average, which helps to differentiate clear price movements from random noise.
By combining a momentum indicator and volatility indicators, the TDI indicator allows traders to spot securities that are set for market reversals back to the average or breakouts from current price patterns.
A Breakdown of the TDI Indicator
The TDI indicator is made up of 4 distinct parts that complement each other when used together.
Relative Strength Index

The relative strength index (RSI) is a momentum oscillator that provides a neutral measure for the market’s sentiment, scored from 0 to 100.
The RSI is calculated by comparing average price changes over fixed periods of time, usually set to 1 day each in the indicator settings.
If a security has many consistently strong days within the given time period, then that indicates that the market sentiment is bullish.
This market sentiment measure helps traders differentiate sharp changes in price (resulting from a relevant news article, for example) from a consistent positive or negative attitude toward a security by the market.
An RSI score of 70 or higher is considered to indicate that a security is in the overbought condition, while a score of 30 or lower indicates that the security is in the oversold condition.
In the TDI indicator, the RSI is known as the Price Line and is generally indicated by a green line.
Simple Moving Average

The simple moving average indicator (SMA) of the RSI shows the short-term trend of the RSI, usually over a 7-day averaging period.
The SMA helps a trader identify consistent trends in a volatile RSI.
The RSI measures general market sentiment, but can still be skewed by extreme market actions over the short term, so the SMA helps to smooth any volatility in the RSI.
Comparing the RSI to the simple moving average indicator allows traders to differentiate substantial trends in sentiment from short-term spikes in buying or selling.
In the TDI indicator, the SMA is known as the Trade Signal Line and is generally indicated by a red line.
Long-Term Moving Average

The long-term moving average indicator (LTMA) is similar to the SMA, but averaged over a longer period of time, usually 34 days.
The LTMA offers both a general baseline from which to view all long-term trends in RSI movements and a contrast to the SMA to identify short-term changes in sentiment.
In the TDI indicator, the LTMA is known as the Market Base Line and is generally indicated by a yellow line.
Bollinger Bands
The Bollinger Bands are a measure of the RSI’s volatility that show a trading channel within which the RSI is plotted, usually denoted by blue lines.
These volatility bands are calculated using 2 standard deviations from the RSI to create a visual image of the RSI’s volatility.
The Bollinger Band channel borders allow traders to visualize the volatility that they are smoothing with the use of moving averages.
The Bollinger Bands provide supplemental information that allows traders to identify how much of a given trend is consistent and how much is caused by the short-term volatility indicated by the bands.

How to Use the TDI Indicator?
In the big picture, the TDI indicator is simply an enhanced version of the RSI.
The RSI is used to measure market sentiment, which is impossible to gauge simply by looking at the price chart of a security.
Therefore, traders use the TDI indicator to identify inflection points in the market’s attitude toward a given security for use in short-term trading.
A shift in the market’s sentiment will lead to consistent buying or selling in the following days.
Consistent buying or selling means that the price patterns will have a clear, predictable upward trend or downward trend that a prepared trader can exploit for profit.
Bollinger Band Basics

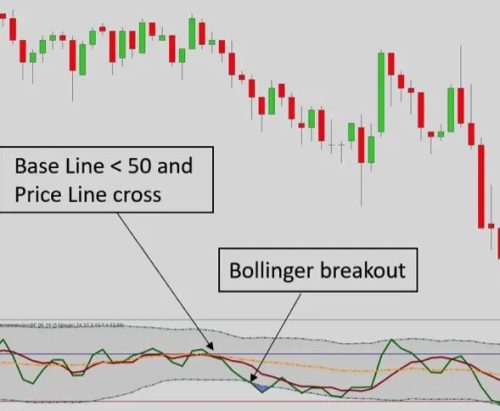
The basic method for using the TDI indicator in market analysis is to identify when the Price Line crosses the blue bands.
For example, a Price Line below the bottom Bollinger Band indicates that the security is oversold, which is usually a buy signal.
The trader can then confirm that this is extreme sentiment positioning by examining the Trade Signal Line and Market Base Line.
If the general trend is consistent according to the Trade Signal Line and Market Base Line while short-term sentiment has suddenly shifted to an extreme, this is a strong signal that sentiment is changing.
Crossovers and More
Advanced traders also use the TDI indicator to identify longer-term shifts in trend directions that allow them to prepare for future trades by forecasting more general market conditions.
For example, when the Price Line crosses the Trade Signal Line, a resistance level, that generally indicates a steady, long-term shift in sentiment in the direction of the Price Signal Line.
Similarly, Trade Signal Line crossovers of the Market Base Line indicate even longer-term trend reversals for that security.
Use the TDI Indicator to Learn More
The best method for learning more about this versatile indicator is by using it to make real or simulated trades.
Being able to interpret market sentiment offers day traders a substantial advantage in trading performance over institutional traders, so the TDI indicator is a valuable tool for any technical analysis toolkit.
TrendSpider is the highest-rated technical analysis software, offering the TDI indicator and many other technical indicators for users to develop and enhance their market-beating trading strategy.
The post What Is the TDI Indicator? appeared first on Modest Money.