A mutual fund portfolio growth visualiser is now available as an add-on module for our Google sheet-based mutual fund and stock investment tracker.
Key features of the portfolio growth visualiser module
- Requires either the mutual fund or mutual fund + stock investment tracker. (see features below)
- Currently, the portfolio visualiser is only for mutual fund portfolios and not stock portfolios.
- Automatically plots the growth of equity and debt mutual funds (asset-wise or total portfolio) from the day you started investing in them* via Google sheet scripts (macros). *On or after April 3rd 2006.
- There is no need to run the macros manually. Easy set-up instructions are included for immediate plotting and weekly updates.
- All mutual fund transactions – of current funds and redeemed funds – can be accounted for while plotting the portfolio growth.
- You can add any benchmark data for comparison. A benchmark portfolio is created assuming you purchased or redeemed the same amounts on the same dates as you did in your MF portfolio.
- The addition and updating of benchmark data are manual, but the comparison is automatic without requiring any script. This is one up on our earlier method: How to benchmark your mutual fund portfolio.
- The add-on module is priced at Rs. 200 only (one-time purchase). Both existing users of the Google sheets tracker and new users can purchase this anytime.
- Remember that the portfolio visualiser is a heavy sheet that needs to be inserted into your existing tracker file. While using it, please do not keep too many browser tabs open.
- Clear video instructions for implementation are given below.
Key features of the freefincal mutual fund and stock tracker (main sheet)
If you do not have the main sheet, you can check out key features and view the demo guides below. All the features are listed here: Google sheet-based mutual fund and stock investment tracker.
- A private, all-in-one-place tracker that is independent of our computers.
- Fast and functionally superior to our previous Excel-based trackers.
- Completely open-source with no hidden formulae. It can be customized at will.
- Easy to share with our life partners as part of our continuity kits. See: How to help our life partner manage money in our absence.
- Updated with current NAV on opening the sheet.
- New SIP transactions will be automatically available (see screenshots and instructions below). If you have multiple SIPs, this sheet can be duplicated to maintain separate records.
- Total equity and debt fund value can be plotted automatically on a daily/weekly/monthly basis (no need to keep the sheet browser tab open!)
- Overall portfolio annualized return (equity + debt), overall equity and debt annualized returns available.
- A basic goal-analysis sheet for ball part estimation of financial goal progress. The current investment value is auto-updated for revised estimates.
- Quickly find the NAV for any fund since 3rd April 2005 to enter lump sum transactions.
- The sheet comes with two financial goal dashboards: one for retirement and one for children’s future. It can be duplicated or customised for other goals.
- Those using a unified portfolio (same investments for multiple goals) can also use the sheet.
- Two variants are available: One for mutual funds and another for mutual funds and stocks. The previously published stock tracker is integrated with this sheet. It gives the annualised return of individual stocks and of the overall portfolio after taking into account all corporate actions like dividends, splits etc., accurately as per SEBI norms avoiding the mistakes made by many stock portfolio trackers.
- All future bug updates and version updates will be made available to users. To ensure you receive these updates, add this email address to your contact list: pattu {AT} freefincal {DOT} com.
- Affordable! The MF tracker costs only Rs. 500. The Mutual fund and Stock Tracker Costs only Rs. 800. This is a one-time purchase.
- We are open to feature suggestions if they would help a wide number of users.
- 100% skin in the game: we are using this sheet to track all our mutual fund and stock investments.
- For support and feedback contact: freefincal {AT} Gmail {Dot} Com
- Get this sheet for free! => A new tool to compare five MF portfolios & find overlapping stocks
Screenshots of the portfolio visualization module
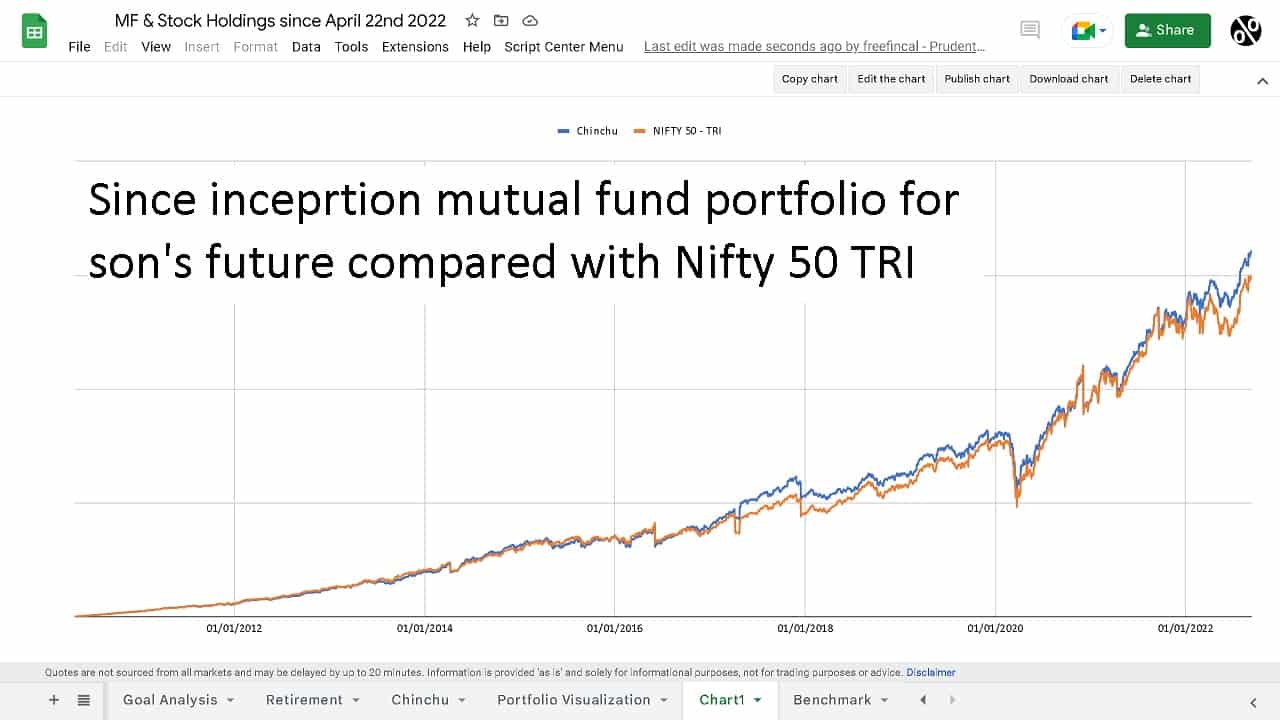
After the Google sheet macros (scripts) are run, the final graph will look like this. This shows the evolution of my son’s future portfolio compared with Nifty 50 TRI. For fund details, see: Lessons from investing for my son’s future for the last 12+ years

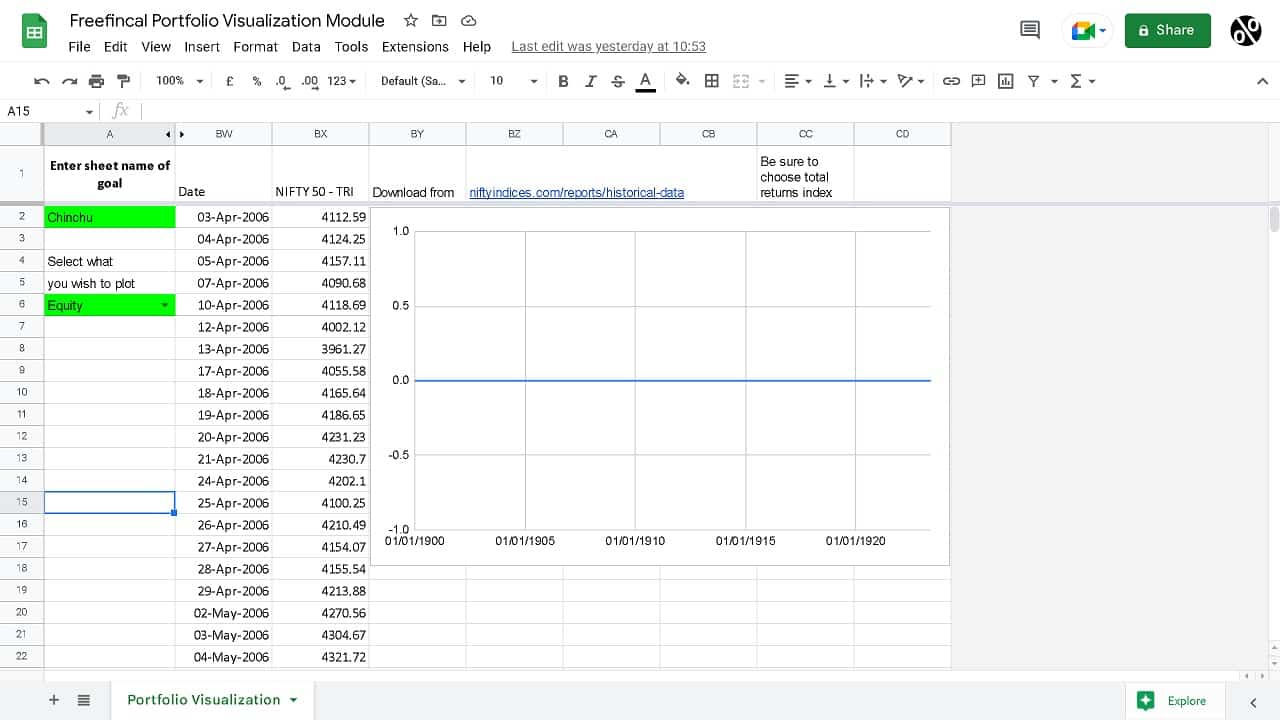
This is how the module will look on purchase. It has Nifty 50 TRI data from April 3rd 2006 to 8th Sep 2022. You can download data beyond this data from the link provided and append it to these columns.

Instructions Manual
Please follow the video on how to set up the portfolio visualization module.
The steps are:
- After purchase, you will be directed to a Google sheets “copy” page. You must like “Make a copy” on your Google drive.
- Open the copied file. Right-click on the “portfolio visualization” sheet and select “copy to” –> “Existing Spreadsheet”.
- Select the name of your freefincal sheet tracker.
- Now open the freefincal sheet tracker and navigate to the newly added sheet.
- Change the name from “Copy of Portfolio Visualization” to “Portfolio Visualization”.
- In the Portfolio Visualization sheet, change cell “A2” to the name of the sheet you wish to track. For example, if it is “retirement”, set it as “retirement”. If it is “child”, set it as “child” etc.
- Steps 5 and 6 are crucial. You will get script errors if these are implemented correctly.
- Now go back to the Portfolio Visualization sheet (newly procured module).
- In the main menu, click on Extensions –> App Scripts.
- You see three scripts: (a) Plotportfolio.gs, (b)RunNow.gs and (c) set-trigger.gs
- Now to the main tracker sheet and in the main menu, click on Extensions –> App Scripts.
- On the left pane, next to “Files”, you will see an “AZ” and a + sign. Click on the + sign and select script.
- A new script file will be created. Rename the file on the left pane to PlotPortfolio and remove the two lines of code in the main body.
- Copy the entire contents of the Plotportfolio.gs from the Portfolio Visualization sheet (newly procured module) and paste it into the new script file.
- Repeat the process for the two other script files: b)RunNow.gs and (c) set-trigger.gs
- Select set-trigger.gs and hit “Run” in the top menu. Triggers to automatically update the portfolio chart in the early hours of each Saturday will be created.
- If you wish to see the chart immediately, select set-trigger.gs and hit “Run”.
- Check back after an hour. The portfolio chart will be ready.
- If you wish to enlarge the chart in its own sheet, select the chart; click on the there dots to the top right and select “Move to own sheet”.
Get the Mutual fund portfolio visualization module (add on for Google sheets tracker) for Rs. 200 only (one-time purchase)
If you have not yet got the main sheet, please scroll down.
Video guides for the main sheet
Mutual Fund Portfolio Tracking
How to benchmark your mutual fund portfolio
Stock Portfolio Tracking
Get the freefincal mutual fund and stock tracker!
After purchase, you will be directed to make a copy of the Google Sheet. Please make a copy and then proceed entering transactions.
Click to pay Rs. 800 and get the freefincal mutual fund and stock screener
Click to pay Rs. 500 and get the freefincal mutual fund screener
Do share this article with your friends using the buttons below.